Killer gas or plant grower

Hydrogen sulfide emissions outside the coast of Namibia 2012. Source: NASA

A poison or a saviour?

Hydrogen sulfide (H2S) is a colorless gas that is heavier than air, smells like rotten-eggs and very poisonous to most organisms (including humans). It results from bacterial breakdown of organic matter in the absence of oxygen, a process known as anaerobic digestion. H2S is very toxic to local marine organisms, fish die in low-oxygen (anoxic) water. The production of H2S is believed to have been one of the contributing causes to pre-historic mass extinctions (Ward, 2007). The theory is that global warming (CO2 increase in the atmosphere) lead to a slowdown in ocean currents as the temperature gradient between the poles and equator diminished, which in turn led to anoxic conditions that produced massive quantities of hydrogen sulfide, killing off vast amounts of plant and animal life. However, last year scientists found that dissolved H2S, in very small doses, can also have a growth effect on plants (Dooley et al. 2013). If correct, we may have found a way to enhance yields without using petroleum, which would be a major breakthrough for humanity. 

Biological effects of H2S

The biological effects of H2S have received increasing attention during the last decade. Not only as a considered kill mechanisms during past mass extinctions but also as an important signalling molecule in organisms. While high levels of gaseous H2S kills plants, extremely low levels of liquid H2S seem to trigger a growth spurt. The origin of these dual activities remains unknown but scientists suggest it might be remnants of biological responses by life evolving in highly anoxic environments of earlier times in Earth’s history. Studies into the effects of sulfide compounds on plants are still few and most have focused on the lethal effects. It is known that H2S causes inhibition of photosynthesis at high concentrations but less is known about what happens at lower exposure.

Increasing yields

A group of scientists at University of Washington reported in 2013 that by exposing plants roots or seeds to very low concentrations of dissolved hydrogen sulfide at any stage of life caused significant increases in biomass, including higher fruit yield. The study found that germination success and seedling size increased in bean, corn, wheat and pea seeds. They also found that time to germination in seeds treated with H2S was significantly less than values observed in untreated seeds (see figure below)


journal.pone.0062048.g002.png
Space Wheat seed (treated H2S seeds in the bottom) photo series taken over 119 hours

Enhanced growth rate continued for seven days after a single exposure, followed by a return to the slower growth unless re-exposed. The H2S exposed plants reacted with cellular divisions, increasing the absolute number of chloroplasts per area. One hypothesis is that H2S does not increase growth rates as a byproduct of the addition of sulfur as a “fertilizer”, as seen through the addition of phosphates or nitrates, but actually impacts cellular replication and photosynthesis. This rapid growth behaviour may have been selected for as toxicity decreases with larger plant size. While this research is recent and further studies are needed, this could have large implications for agriculture and biofuels.

0 kommentarer:

In search of alternative energy technologies

Greater energy availability corresponds with greater quality of life. Source: Lambert et al. (2013)

Alternative energy technologies

Economic progress and wealth of society strongly depends on the best choice of energy supply techniques. Like with any living organism, societies needs energy to perform work. Before the industrial revolution we relied on horsepower, wood, wind and human labor. These forms of energy were, however, very inefficient because of their low energy density. It was not until we discovered coal and invented the stream engine that the revolution started and societal metabolism went up. Since then, humanity has been addicted to fossil fuels to propel our societies forward. Now, however, its becoming a real problem because the Earth is not as big as we thought. Fossil fuel extraction and pollution on a massive scale have caused our climate to change and we are running into limits of what the Earth can provide in terms of cheap and abundant natural resources. So we look to alternative technologies for solutions to this predicament. But as we know from the German case this issue is not without its challenges. We need a measurment that that can establish what alternative are most effective in terms of providing a net surplus of energy to society while reducing greenhouse gas emissions. 

Energy return on energy invested

The energy return on (energy) investment (EROI) is an important measure that describes the overall life-cycle efficiency of energy supply techniques, independent of economical and political considerations. The EROI answers the simple question “how much useful (net) energy do we obtain for certain effort to make this energy available” (Weißbach et al. 2013). As we know, energy and matter are never consumed or generated but always just converted. There is always a flow of materials (fuel, materials for construction, maintenance) driven by the “invested” energy with the result of making the “returned” energy available. This means that to calculate net energy of a particular supply technique, also known as carrier, one has to include all the energy it takes to produce electricity - from the extraction of resources to the construction and maintenance of the plant, as well as expected lifetime. Furthermore, because many so called renewable carriers are intermittent they usually require back-up plants or storage that can buffer for when they aren't generating enough electricity at times when people need it. 
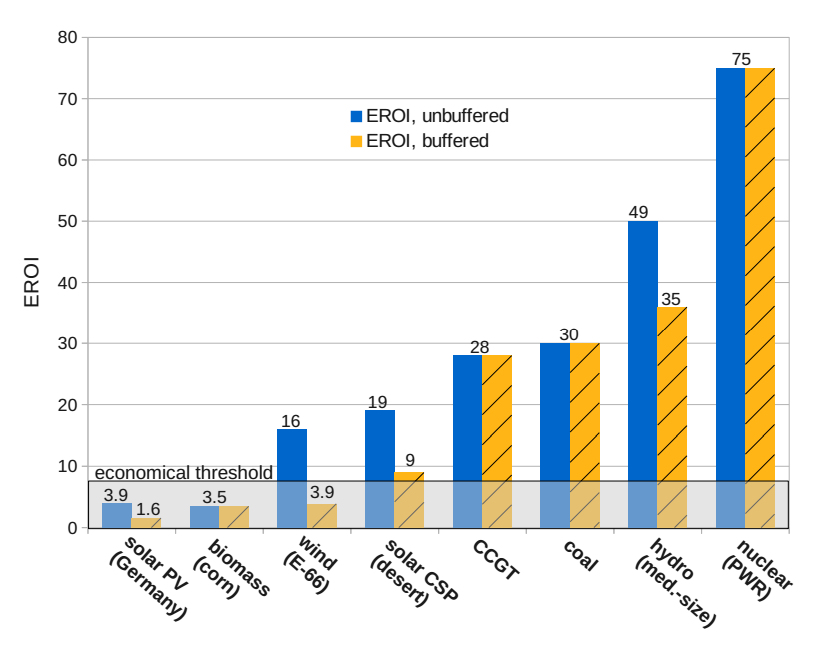
Weißbach et al. 2013 have chosen to include this in their EROI analysis, few others do. Break-even has an EROI of 1. But that would be pointless as you would have a plant but couldn’t run it. The higher the EROI the higher the return on investment.

As the graph above shows, solar photovoltaics and biogas from corn require so much energy that there is very little net energy provided to society, you put in 1 and get 3.9 or 3.5 back (even worse if you include the buffering). That’s not enough to run a complex society on. Wind onshore and hydropower, however, perform much better and give a return of 19 and 49 respectively. Natural gas and coal fired power plants give 28 and 30 in net energy. And nuclear has a value of 75, calculated with a 60 year lifetime. Solar thermal in the Sahara would also give enough net energy to be useful.

Energy Money Return on Investment

Now that we know which electricity producing technologies offer most in terms of net energy we can turn to monetary cost. But first note that not all energy is created equal. Electrical energy is very useful, because it can immediately do work. Heat and chemical energy are less useful because it's harder to get work out of them. By calculating the exergy, the available energy to do work, equivalent we can get energy money return on investment (EMROI). This is done by weighting both the energy inputs and energy output by a factor of 3 when the energy type is electrical. As shown in the graph below.

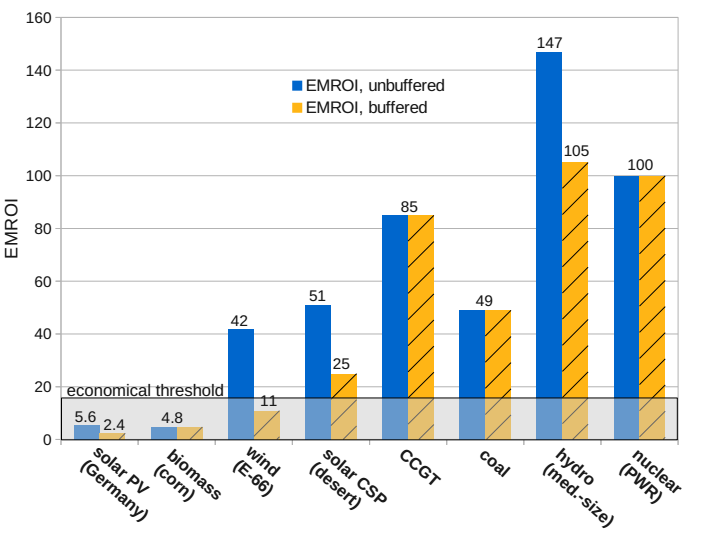
Because all these carriers produce electricity as output, but not all inputs are electric, the EMROI of all sources is higher than their EROI. This is one step further towards monetizing the EROI by allowing for the greater monetary value of electricity compared to other energy types. We can see that hydro, nuclear, natural gas and solar in the desert have high EMROI. However, EMROI is just a “best case” scenario for monetary return on investment. Note that the economic threshold has gone up to. The idea is that in e.g. the US, a kWh of energy cost about 10 cents but it produces about 70 cents worth of GDP, a ratio of 7 to 1. If we do the same computation in exergy terms, the ratio is 16 to 1. That means the fully monetary return on investment of exergy, for the economy as a whole, is 16. A similar ratio can be seen for other countries which leads to the conclusion that the thresholds are 7 for EROI and 16 for EMROI, assuming OECD-like energy consuming technology. For lower developed countries thresholds might be smaller, thus making also less efficient energies like biomass economic.

Greenhouse Gas Emissions

By looking at historical development rates of low-CO2 electricity production among different high-income countries we can try to figure out what techniques have worked well previously. Below is a chart showing OECD countries population size and generation of kWh per capita per year.

Renewables (left) and nuclear (right). Source: Davour et al. (2014)

Overall we can see that only a few countries have succeeded to build low-CO2 electricity production with a rate of 300kWh/cap/year, which is the needed improvement speed to stay below the Kyoto Protocol 2 C degrees limit. One should note that no country have made it above the 300kWh/cap/year without the help of nuclear. We can see that Swedish nuclear development reached the highest level of 700 kWh/cap/year. Mean development rate only reached 120 kWh/cap/year between 1982 and 1992. When it comes to renewable electricity production, Denmark has the highest with about 160 kWh/cap/year. Closely followed by Sweden. Spain and Germany reached levels of 120 kWh/cap/year. We can see that Sweden has a top position in development rate of low-CO2 electricity production, both with nuclear and renewable energy. If the rest of the world would implement nuclear at the same rate as Sweden did, it would take 25 years to replace all existing fossil fuels (Davour et al. 2014). It is very improbable that this will happen, and perhaps isn't recommendable, but the example show how important the inclusion of nuclear into the energy mix is for future low-CO2 electricity production.

Discussion

This is just one out of many studies that have looked at EROIs for various energy carriers. Because there is no universally accepted methodology one should be careful about taking any numbers for granted until reading the literature. These numbers are however in line with other studies, except in the case of nuclear. Previous studies have shown extremely varied numbers for nuclear. This could be because, since the 1980s when EROI measurements began, EROI for nuclear has been rising rapidly as the industry has switched from gas-diffusion enrichment of uranium to centrifuge (which is 35 times more energy efficient). The World Nuclear Association projects that there will be no more diffusion enrichment anywhere in the world by 2017. Moreover, there are other processes and a next generation of nuclear power plants, called Gen-IV designs, that don’t use enrichment at all which would give them much higher EROI. And Gen-IV models can't have a melt-down. The Chinese have 300 engineers working on a liquid-cooled thorium reactor right now. So if you wondered why climate scientists like James Hansen are pro-nuclear, this is one reason.

Data from Davour et al. 2014

Yes wind is fine if it can be grid-buffered against a non-fossil generating source and heavily subsidised. And yes we would need more hydro but many of the worlds rivers are already utilized and it can have massive effects on ecosystems and the hydrological cycle. 

So if we want to eliminate fossil fuels from electricity production and if we want to manage that transition without wrecking the economy, nuclear may have to be part of the energy mix. I therefore think that we should support our Swedish scientists in their wish to develop a Gen-IV lead-cooled test reactor that would reuse nuclear waste, minimizing the half life from 100 000 to 1000 years, sparing future generations the worries (Davour et al. 2014). Unfortunately the Swedish government has not been able to make any clear decisions regarding our future energy system, and the future of nuclear research, despite the fact that many Swedes accept nuclear power and don't want to see eary decomission.

0 kommentarer:

Record Warming 2014

Global temperatures January-October


According to the US National Oceanic and Atmospheric Administration (NOAA) the first ten months of 2014 (January-October) were the warmest such period since record keeping began in 1880. Global land and ocean average surface temperature reached 0.68 °C above the 20th century average of 14.1°C. Making 2014 on track to become the warmest year on record. Record warmth for the year so far has been particularly notable across much of northern and western Europe, parts of far east Russia, and large areas of the northeastern and western equatorial Pacific Ocean.

Source: NOAA, 2014

Sweden was warmer than average during October, with the southern half of the country experiencing temperatures 2-4°C above their October averages (SMHI). On October 28, the daily temperature in Stockholm was 14.2°C, the highest daily average observed so late in the year since records began in 1756. 

Northern Hemisphere is warming faster

Looking at historical records  of Land and Ocean surface mean temperature anomalies we can see that the northern hemisphere is warming much faster, with some of the most rapid warming rates on Earth located in the Arctic, where sea and land ice is shrinking and thinning.

Source: NOAA, 2014
Changes in albedo (i.e. reflectivity) difference between the Arctic and Antarctic and global ocean currents contribute to the Northern Hemisphere’s rapid warming, according to researchers from Potsdam Institute for Climate Impact (Feulner et al. 2013). Currents transport heat away from southern waters and into the North Atlantic and North Pacific, helping to warm nearby land areas in the north even more. For example, the Gulf Stream, which carries heat from the tropics far into the North Atlantic, along the Scandinavian west coast (see map).


Source: Tellus

Melting Arctic = More Extreme Weather?

Temperatures in the Arctic have risen twice as fast as the rest of the world, a phenomenon known as Arctic amplification (Cohen et al. 2014). Scientists have linked the rapid rise in Arctic temperatures over the past two decades to weather extremes in the Northern Hemisphere such as heatwaves in the US and flooding in Europe (Coumou et al. 2014, Francis 2014). Rapid warming in the Arctic can have triggered changes to global wind patterns, which have brought extreme weather to lower latitudes. Extreme weather events have almost doubled over the last two decades. Now researchers think that this can be linked with unusual weather patterns in the upper atmosphere, influenced by warmer Arctic temperatures. They believe that the loss of sea ice in the Arctic may be contributing to the appearance of wide north-south swings in the high-altitude winds flowing globally west to east around the polar region, causing them to “get stuck” and amplified in a quasi-stationary pattern known as a “standing wave”. When interviewed by the Independent one of the researchers, Stefan Rahmstorf, said “Evidence for actual changes in planetary wave activity was so far not clear. But by knowing what patterns to look for, we have now found strong evidence for an increase in these resonance events” (Professor of Physics and co-chair of Earth System Analysis at Potsdam University). The possibility of a link between Arctic change and mid-latitude weather has spurred research activities that reveal three potential dynamical pathways: changes in storm tracks, the jet stream, and planetary waves and their associated energy propagation (Cohen et al. 2014).

Changes in precipitation

A study from Berkeley has projected that if emissions remain on their present upward trajectory, the average temperature difference between the two hemispheres could be about 1.6°C. This would be sufficient to alter tropical rainfall patterns, which could affect everything from rice cultivation in India to the health of the Amazonas Rainforest (Friedman et al. 2013). According to the authors, tropical rain bands that form near the equator where trade winds collide to build up thunderstorms may shift northward, drying out parts of the Southern Hemisphere, while causing more precipitation in the North. 

0 kommentarer:

Myths and Facts about Organic Farming

Media storm about organic farming


There has been a media storm lately regarding the productivity of organic farming compared to conventional farming methods in the two major Swedish daily newspapers. The debate has mostly been between different groups of scientists having a “pro” conventional farming attitude versus scientist being “pro” organic farming. It all started with a group of scientist from the Swedish University of Agricultural Sciences (SLU) promoting a new book in which they claim that ecological farming on a massive scale would lead to starvation because of lower yields. In response a number of other scientist argued that these type of statements where unscientific, emotional and cherry picking of statistic without providing a proper context (for more on the content of the debates see DN and SVD). So I did some digging and the following post will bust some myths and present some facts about organic farming. Before I go on to some of the statements posed in the article, I will just briefly give some context to the challenges we are facing globally regarding food production.

The challenge of sustainable food production


Today there are 7.2 billion people on the planet. In a world committed to feeding a population of 9.6 billion by 2050 (UN, 2013) we face unprecedented risks and challenges. As we know, we are currently putting extreme pressure on the Earth’s climate and ecosystems. There are so many of us now that we are disrupting the whole planet’s nutrient and energy flows and degrading ecosystems worldwide (MEA, 2005; Rockström et al. 2009). Food production is central to solving our environmental dilemma. Over 35% of Earth’s land surface is devoted to agriculture which gobbles up 70% of global freshwater use and contributes with 30% of global greenhouse gas emissions (Foley et al., 2011). Climate change (fig1) and topsoil erosion (fig2), interacting with increasingly uneven access to declining oil, water, and phosphorus supplies (Sverdrup et al. 2013) will greatly exacerbate the unpredictability of agricultural production. Yet an estimated 33% of global food production is wasted (FAO, 2011). This is a depressing fact of how unsustainable our current food system is. Globally, we need to reduce waste and make food more accessible to vulnerable people at the same time as we raise farmers livelihoods. And farming systems need to go from carbon source to carbon sink, building organic matter in soils, raising productivity and resilience to droughts. Sweden is in a unique position to meet these challenges because we have a small population relative to land area and crop yields will increase as climate warms (not accounting for potential increase in floods etc). 


Climate change projected impacts on crop yields 2050 (3° C World). Source: WRI (2013)


The area of agricultural topsoil of the Earth peaked in 2005. Soils form very
slowly, of the order of millimetres per 100 years. Source: Sverdrup et al. 2013


Busting Myths 

Myth 1. Organic farming leads to starvation
This statement is just plain wrong. People are not starving due to lack of food production, there is enough food (enough for 12-14 billion people). People starve because of poverty, lack of access to food, infrastructure and trade policy. 1 billion people suffer from starvation and another billion is malnourished, despite the fact that 70% of these people are themselves small farmers. The conventional food system is broken. In a global agricultural assessment on behalf of the UN and the World Bank, 400 experts came to the conclusion that new food production practices based on ecological principles is the future (IAASTD, 2011). Another study from the UN with the title “Wake up before it is too late” (UNCTAD, 2013) concludes that the world needs a paradigm shift from a “green revolution” to an “ecological intensification” approach, from todays conventional, monoculture-based and high external input dependent industrial production towards mosaics of sustainable, regenerative production systems that also improve the productivity of small-scale farmers.

Myth 2. Organic farming results in half the amount of food
Incorrect. Badgley et al. (2006) compared average yield ratio (organic:non-organic) and found that organic methods could produce enough food on a global per capita basis to sustain the global population, and potentially more. They further concluded that leguminous cover crops could fix enough nitrogen to replace the amount of synthetic fertilizers in use. A study in Nature (2012) found that organic yields tend to be lower than conventional yields but that this is highly contextual. The authors state that under certain conditions (i.e. good management practices, particular crop types and growing conditions) organic systems can nearly match conventional yields. Good management practices include for example: composting, no tilling, and rainwater harvesting. In Sweden, conventional farms may give a higher yield but this is not the case in developing countries.

Myth 3. Organic farming cannot provide for a growing population
As shown above this is not true, there is the potential but a major problem is that 70% of agricultural lands are used to raise cattle (FAO, 2006) and 30% of produced food is wasted. If we really wanted to limit our impact on the environment and world hunger we should eat less meat and stop throwing away perfectly good food. 

Myth 4. Organic farming is worse for the environment

Wrong! I cannot believe these people are scientists. Organic farming when applied with sound agro-ecological principles (such as crop rotation, keeping livestock and crops on one farm to supply for fertilizers, keeping patches of vegetation and trees for animals to migrate e.g. pollination bees) is good for the environment, animal welfare and humans.  According to Livsmedelsverket, ecological farming replaces chemical fertilizers and pesticides with other agricultural methods (e.g. livestock manure). Feed for livestock is mainly produced on the farm and the use of drugs e.g. antibiotics are limited. Animals also get more time to pasture and genetically modified organisms (GMOs) are not allowed. Jordbruksverket (2012) estimate large benefits with lower use of chemicals and increased living space for wild plants and animals etc.  


Illustration from Granstedt (2013)

A look at Swedish Agriculture and Food Consumption

In 2010, Sweden had 81 ha/holding of organic farming, above 10% of utilized agricultural area (European Commission, 2013). Of current total cropland about 75% is considered to have high yields, resulting in 800 000 hectares with potential for improvements (LRF, 2012). Most greenhouse gas emissions from agriculture comes Nitrus Oxide (N2O) emitted through the use of synthetic fertilizers. Nitrous oxide is also emitted during the breakdown of nitrogen in livestock manure. Methane (CH4) is the second most prevalent greenhouse gas emitted from agriculture. Domestic livestock such as cattle and sheep produce large amounts of CH4 as part of their normal digestive process. Also, when animals' manure is stored or managed CH4 is produced. The third most common greenhouse gas emitted from agriculture is carbon dioxide (CO2) from cultivated fertile soils (see chart below). Conventional heavy soil tillage influence CO2 emissions because it accelerates the loss of soil organic matter. See chart below for overview of emissions from agriculture. In Swedish agriculture, crops only use 40% of the supplied Nitrogen and 65% of the supplied Phosphorus and only a small fraction are recycled into croplands. Here we could make improvements.

But what we eat also matters. Sweden imports 50% of all food consumed, compared to the 30% in 1950 (LRF, 2012). Food consumption and waste amounts to 25% of Swedish household greenhouse gas emissions (Naturvårdsverket, 2008). What we eat has to change if we want to meet our climate goals according to one report (SLU, 2012). Below is a chart showing greenhouse gas emissions from various protein sources.
Data from SLU (2012)
We can do more but today it often comes down to producers and consumers. Farming is not a lucrative business and many farmers, especially small and medium sized, rely on government subsidies to make a living. But Sweden is in a unique position geographically with increases in yields as climate becomes warmer, compared to decreases in yields close to the equator and the south. At the same time loss in yields in many of the large grain areas of the world will likely make food overall more expensive, so relying on imports to such a large extent is perhaps not a sound food security strategy. We need to bare this in mind when we make future plans for our agricultural sector.

Conclusion

By giving a oversimplified and many times incorrect picture of organic farming the SLU authors seems to have a vested interest in conventional farming or simply provoking debate to gain attention for their new book. But organic farming has become a topic of scientific controversy it seems. It need not be, we need all the improvements we can get. For example, agriculture and food production is still largely dependent on oil for machinery and transportation. It will be difficult to replace that input. Organic food production is no panacea for more sustainable food production everywhere. Context matters. But I am glad that we are having a debate about what type of farming we want to promote. I also think we have an obligation towards farmers here and around the globe to provide them with support and sufficient funds for sustainable practices since our very future depend on them growing our food. According to the UN there is a farmer suicide crisis worldwide. The impact of an industrial approach to boosting crop yields has stripped many small farmers of their self-sufficiency and thrown them into despair. Financial pressures, livestock disease, poor harvest, climate change, government policies and legislation can devastate farmers. We may run the risk of losing valuable knowledge skills, at a time when we need them the most. 

0 kommentarer:

Why you should care about the Arctic

Arctic Sunset. Wikimedia Photo: P J Hansen 

The Arctic is Warming


Rising temperatures in the Arctic are contributing to melting sea ice, thawing permafrost, and destabilization of a system also known as “Earth’s Air Conditioner”. The Arctic regulates ocean and atmospheric circulation and keeps the the planet cool. Climate change is impacting weather patterns, natural systems, and human life around the world. The Arctic, however, is central to these impacts as it is warming more rapidly relative to lower latitudes, about twice as fast as the rest of the globe, making it “the canary in the coal mine”. What happens in the Arctic is of utmost importance to us humans if we want to know how climate change will impact our only home, planet Earth.

Reinforcing feedbacks and potential tipping points


The Arctic is very sensitive to global heat forcing, and any small warming there could rapidly trigger a number of feedbacks that generate more warming for the Arctic and the globe. These feedbacks include but are not limited to: A) snow and ice melting; B) changes in ocean and atmospheric circulation; C) thawing permafrost and methane release. The concept of a “tipping point” - a threshold beyond which a system shifts to an alternate state - has become familiar to most people concerned with the climate debate. If tipping point means crossing a critical threshold in which a system enters substantial, potentially irreversible, change that causes it to move into an entirely new state, there may be precursors or early warning signals of such change. Such warnings are exactly what climate researchers and ecologists are looking for and trying to map out. The graphic below shows potential tipping elements in the Arctic region.

Map show potential tipping points in the Arctic region: ice melting (white); ocean and atmospheric circulation (aqua green); and biome changes (dark green).
Source: Lenton (2012)
Snow & Ice melt

greenland_ice_sheet_reflectivity_2012.png
Source: meltfactor.org
As snow and sea ice retreat, exposing land and sea with lower albedo (i.e. less reflectiveness), more solar energy is absorbed, thus leading to further melting and retreat in a vicious cycle. The present thinning and retreat of Arctic sea ice is one of the most serious geophysical consequences of global warming and the rate of ice melting have greatly exceeded the predictions of most models (Wadhams, 2012). Experts suggest that we may have, in 2007, passed a tipping point towards having sea-ice free summers in the Arctic (Livina and Lenton, 2013). Some studies suggest that the Arctic could have sea-ice free summers in only a couple of years, 2016-2020 (Maslowski et al. 2012; Wadhams 2014) while others predict it to occur later, around 2041-2050 (Cawley 2014Liu et al. 2012) given continued warming. Eighty-one percent of Greenland, which is located mostly inside the Arctic Circle and is the world’s largest island, is covered by ice. The Greenland ice sheet is currently losing mass at a rate that has been accelerating (Lenton, 2012). And in July of 2012 Greenland ice sheet reflectivity at 2000m-2500m collapsed during the summer (figure 1). In a study published in Nature Reyes et al. (2014) argued that between 4.5 and 6.0 meters of sea level rise 400,000 years ago could be attributed to a collapse of Greenland's southern ice sheet. Data from marine records in the North Atlantic show that the average temperatures in Greenland during that period were only about 1°C warmer than today’s temperatures. The similarity in climate between then and now “suggests the threshold for ice sheet collapse is pretty low”, according to one of the co-authors, “We could be nearing the tipping point” (Oregon Live, 25th June 2014).

Changes in ocean and atmospheric circulation

In recent years radical shifts in atmospheric circulation patterns have occurred in the Arctic, strengthening poleward heat transport and bringing warm air and warm ocean currents from the Atlantic right into the centre of the Arctic (Lenton, 2012). This behavior in wind and water circulation limits winter sea-ice growth and thus contributes to further summer sea-ice decline. The additional warming in the Arctic affects weather patterns in the Arctic and beyond by altering the temperature gradient in the atmosphere and atmospheric circulation patterns (WWF, 2011). The polar jet stream is a high-altitude, blisteringly fast wind that blows around Earth at mid- and polar latitudes. It dips into and out of the Arctic, shifting high and low pressure air masses. Rising temperatures in the Arctic slows and increases the waviness of the Jet Stream which generates more south to north transfer of temperate and tropical warmth into the Arctic together with a greater export of Arctic cold to lower latitudes. Experts view a tipping point for ocean circulation to be somewhere around 4C warming (Lenton, 2012) while atmospheric circulation is more difficult to assess and needs to be further investigated.     

Thawing permafrost & Methane 

permafrost_feedback.jpgPermafrost—the ground that stays frozen for two or more consecutive years—is a ticking time bomb of climate change. Some 24 percent of Northern Hemisphere land is permafrost. That's 23 million square kilometers found mostly in Siberia, the Tibetan Plateau, Alaska, the Canadian Arctic, and other higher mountain regions. When the Arctic warms, permafrost can start thawing and releasing carbon and methane into the atmosphere (figure 2). In a controversial paper in Nature, Comment, Whiteman et a. (2013) posited a scenario whereby a 50 Gigatonne (Gt) methane pulse would occur over a decade time period and calculated its potential economic costs. To put this in context, the total amount of methane in the world’s air now is about 5 Gt, and the annual input is about 0.5 Gt, so this would double the methane in the air within the first year. Newspapers such as the Guardian and popular blogs were quick to pick up the story and claimed that there was a possibility of an Arctic “methane bomb”. Following articles have, however, shown little evidence pointing to the likelihood of such a scenario. A group of international scientists wrote in Nature Geoscience in 2014 that “significant quantities of methane are escaping the East Siberian Shelf as a result of the degradation of submarine permafrost over thousands of years” (Shakova et al. 2014). The authors claim that a sudden release of methane, in a “pulse”, seems unlikely and that methane will probably continue to bubble up slowly, contributing to greenhouse gases in the atmosphere. But they do caution that its possible that global warming could cause more storms in the Arctic Ocean, releasing methane on a bigger scale. There is no established tipping point for methane release, but some studies suggest that a tipping point for continuous Siberian permafrost thaw could be as low as 1.5°C warmer than the pre-industrial period (Oxford University). 

Consequences

Sea level rise
Sea level rise at +1-4C warming scenarios. Source: PIK

Sea levels are rising due to thermal expansion from warmer oceans and melting of land-based ice. Satellite measures since 1993 show global sea level rise of around 3.2 mm/year (CSIRO). The potential for increases in sea level rise is enormous because the ice caps of Greenland and Antarctic contain over 99% of all the freshwater on Earth (NSIDC). Estimates suggest that if Greenland ice sheets would melt completely it could raise sea level 6 meters. In other words, a one per cent loss of the Greenland ice cap would result in a sea level rise of 6cm (NSIDC). In a process that is accelerating, ice caps are losing mass. In past periods of Earth’s history, levels of atmospheric greenhouse gasses and sea levels have followed one another closely, allowing an inference about where sea level is headed. Sea levels may rise by more than 2 meters for each degree Celsius of warming the planet experiences over the next 2000 years (see figure), according to one study (Levermann et al. 2013). But even a one meter sea level rise could cause major problems for low-lying countries such as the Maldives and Bangladesh, forcing inhabitants to migrate. Around 150 million people live within 1 metre of high tide level (CSIRO). Coastal cities, ports and airports could be flooded, as could cities sited near tidal estuaries, like London. And many nuclear installations are built by the sea which is of great concern knowing what happened in Fukushima.

Extreme weather events 
Jet stream and hurricane Sandy.
Source: mprnews

Shifts in atmospheric circulation could influence weather patterns. Rising temperatures seems to slow down and increase the waviness of the jet stream, increasing long duration extreme weather patterns such as droughts, floods, and heatwaves (YaleEnvironment, 2012). This has significant impacts on temperature and precipitation patterns in Europe and North America. That weather patterns can "get stuck" might explain why the intensity of extreme weather events has increased. We have seen many examples of “stuck” weather patterns during the past few years. Deep southward dips in the jet stream hung over the U.S. east coast and Western Europe during the winters of 2009/2010, 2010/2011, and 2012/2013 bringing a seemingly endless string of snow storms and cold. In the early winter of 2011/2012, in contrast, these same areas were under northern peaks in the jet stream which brought unusually warm and snowless conditions (Francis, 2013). And in summer times persistent weather have been responsible for droughts and heat. The record heat waves in Europe and Russia have been linked to early snowmelt in Siberia (Jaeger and Seneviratne, 2011). These changes affects agriculture, forestry and water supplies. For example, farming becomes more precarious as weather patterns and prognosis are no longer reliable. Changes in weather patterns also impact storm surges and hurricanes. Some scientists suggest that changes to the jet stream drove hurricane Sandy west, towards the coast of northeastern United States (LiveScience, 2013). Ranking as the second costliest hurricane in United States history (Huffington Post, 2013) one can see how changes to storm patterns can have enormous costs to society and the economy.

Warming & Acidic Oceans
Coral reef at +1-3C warming. Source: FurmanWiki

The complete loss of Arctic summer sea ice has major knock-on effects, such as boosting phytoplankton and absorbing more heat in the oceans. Ocean warming effects marine life in temperate latitudes making species such as cod, haddock and flounder shift their geographic ranges, leaving fewer cold water species (NASA, 2013). Disease also spread faster in warmer water so parasites are having larger effects on species, especially sensitive coral reefs. Because the planet’s oceans currently absorb about a quarter of the carbon dioxide, which lowers the pH level of the water, the oceans are becoming acidic. Acidification makes shell-formation among marine organisms such as plankton and mollusks more difficult, which could have major cascading effects on marine life as these organisms make up the base of the ocean’s food chain. Coral reefs, which are marine biodiversity hotspots, are particularly sensitive to changes in temperatures and pH. Coral reef ecosystems are in global decline and this means loss of storm buffers and loss of estuaries for fish species that generate 200 million jobs and food for a billion people (NOAA).

Summary - Tipping points

Greenhouse gasses
According to most scientists, a CO2 amount of order 450 ppm or larger, if long maintained, would probably push Earth toward an ice-free state (Hansen et al. 2008, 2013). 450 ppm is considered a climate tipping point, beyond which we would have no control. We are at 400 ppm today, which constitutes high risk of transgressing the tipping point. According to science we need to get back down to 350 ppm to be considered in the safe zone. 

Arctic ice free summers

Some studies suggest that we may have passed a tipping point in relation to having sea-ice free summers in the Arctic already in 2007 (Livina and Lenton, 2013). The loss of reflective surfaces in the summer reinforces further warming, as dark water absorbs more heat from the sun, causing further melting. The loss of summer sea-ice cover is reversible, given that warming slows down (i.e. drastic reduction in greenhouse gas emissions). 

Greenland ice sheet

By looking at sediment records a team of scientists found that 1°C warmer than today's temperatures in Greenland contributed to a 4-6 meter sea level rise from the collapse of the southern part of the ice sheet (Reyes et al., 2014). 

Permafrost methane release

At 1.5°C warming, from pre-industrial levels, Siberian permafrost starts thawing on a large scale (Vaks et al., 2013). Crossing this tipping point could potentially lead to runaway climate change because of the scale of carbon stores and because methane is 20 times more effective in increasing global temperatures than equal amount carbon dioxide.

Conclusion

What is happening in the Arctic impacts us all. Rapid climate changes are now taking place in the Arctic with impacts on a planetary scale. We do not know how to fix it except from lowering our emissions. Many experts say we need a rapid reduction in greenhouse gas emission, starting now. Global leaders have to come to an agreement that substantially reduces emissions, the rich world taking the lead. Our only home, the Earth, is changing rapidly and we are now running into dangerous risks of substantial warming and triggering climate tipping points that reinforces further warming beyond our control. The last call is coming up in November of 2015 Paris Climate Meeting. “The Arctic acts as an early warning system for the entire planet” (Dr. Chip Miller, NASA Jet Propulsion Laboratory). We should all follow what happens there closely and warn the world of the potential dangers of going on with "business as usual".

0 kommentarer: