Showing posts with label extreme weather. Show all posts

Faster than forecast - Melting Arctic


Half a truth is often a great lie. - Benjamin Franklin

Abrupt climate change in the Arctic

Ice covers 10 percent of Earth's surface and helps moderate the planet's temperature. Glaciers, sea ice and ice sheets around the world are melting at an alarming rate. Much faster than climate models had predicted, like what Peter Wadhams, expert on ocean and ice physics, discusses in the video clip above. Climate models fail to interpret the real climate system because they ignore nonlinear dynamics, like key carbon cycle feedbacks and tipping points, crucial to the real system.

The Arctic (North of 60° N) is a key strategic region of global importance. Changes in the Arctic impact Earths energy balance, cloud formations, global wind patterns and ocean currents, release of methane, sea level rise, phytoplankton blooms and much more. As seen in the image below.

Component state variables and dynamic processes operating in the Arctic. There are strong couplings, feedbacks and nonlinear behaviors arising from their interactions, which together define the Arctic system. Source: Arctic System Synthesis, 2018


A recent study published by NASA shows how, since 1958, Arctic sea ice cover has lost about 66% of its thickness, averaged across the region at the end of summer. Old ice has shrunk more than 2 million square kilometres and today 70% of the ice cover consist of ice that forms and melts within a single year. Thinner, weaker seasonal ice is much more vulnerable to weather than thick ice and can easily be broken apart by storms. 

That's very bad news for our planet as darker ocean waters absorb more sunlight and triggers further warming. Melting sea ice has already contributed to about 25% of current warming but could add double that amount when the Arctic ocean starts becomes ice free in summer. That's a very strong reinforcing feedback process that accelerates warming which in turn accelerates further ice loss and so on. While in theory, with some sort of risky geoengineering, it would be possible to reverse this trend I really doubt we can do much to stop it. We can't even stop our greenhouse gas emissions from growing every year. No, its too late for Arctic sea ice, what we see now is a death spiral. 

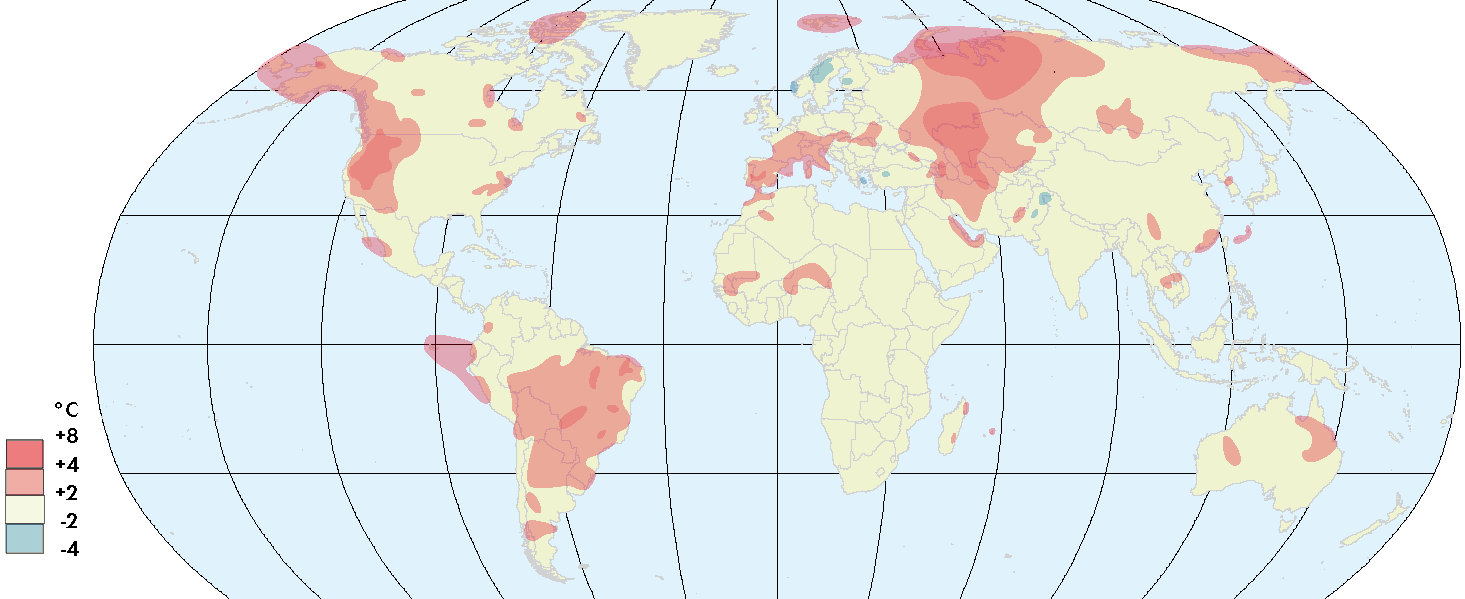
Warming in the Arctic occurs much faster than at lower latitudes, a process known as Arctic Amplification. Arctic temperatures have increased at least 3 times the rate of mid-latitude temperatures relative to the late 20th century, due to multiple reinforcing feedbacks. Even if global temperature increases are contained to +2° C by 2040, Arctic monthly mean temperatures in fall will increase by +5° C. The Arctic is very likely to be sea ice free during summer before 2040, and probably much sooner than that. Not like the IPCC report says, once in every hundred years.

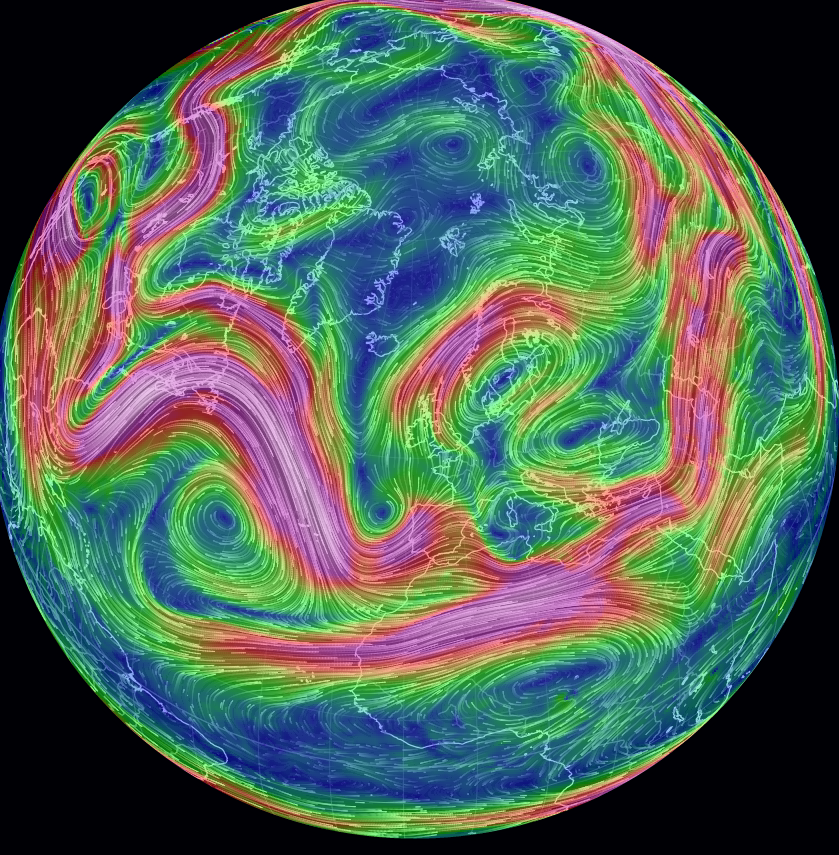
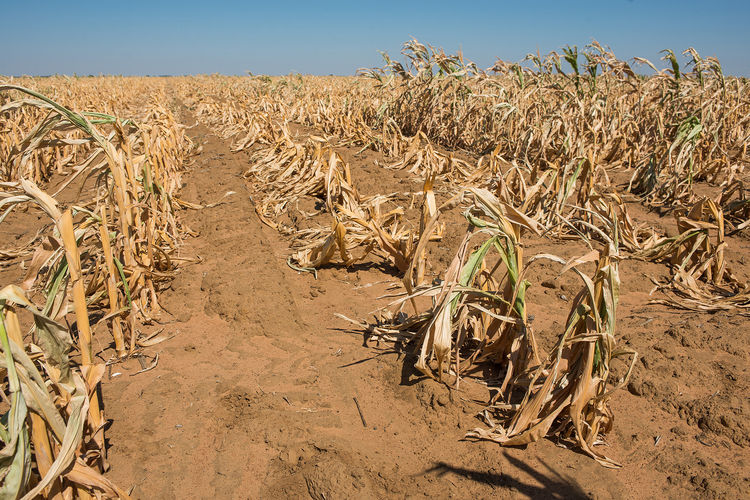
This will impact mid-latitude, like Europe, weather events by causing the jet stream to slow down and become more meandering which causes more persistent weather patterns as high or low pressure weather systems to get stuck in one place for an extended duration. Like what we saw this summer in Scandinavia with persistent heat wave, drought and forest fires i Sweden.

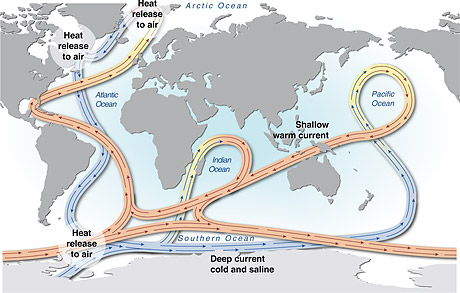
We have also detected a slowing down of the Atlantic meridional overturning circulation (AMOC) during the past 150 years since the little ice age, and that enhanced freshwater fluxes from the Arctic and Nordic seas weakened Labrador Sea convection and thus the AMOC. Its been suggested that the lack of a subsequent recovery may have resulted from hysteresis (i.e., instability of thermohaline circulation) or from 21st century melting of the Greenland Ice Sheet.

Another recent Nature article  improved a sea surface temperature proxy for AMOC strength. Their proxy AMOC fingerprint consists of a cooling in the subpolar gyre region due to reduced heat transport, and a warming in the Gulf Stream region due to a northward shift of the Gulf Stream, indicating that AMOC has been steadily weakening since around 1950, strengthened shortly during the 1990s and 2000s, then weakened again. In the short term this could cause a small cooling effect in western Europe while warming the ocean waters in the gulf of Mexico, southeast Americas. Not mentioned in the latest IPCC report. 

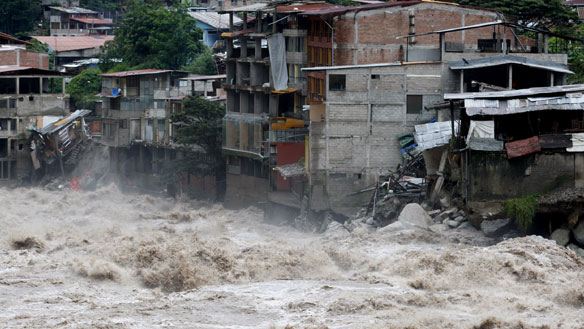
Last time Earth went through an interglacial period, and global temperatures were less than 1C warmer than today, sea level rose to +6-9 meters and extreme storms were common. Sea level rise has accelerated as ice sheet loss on Greenland and West Antarctica has accelerated. Also not accounted for in the latest IPCC report.

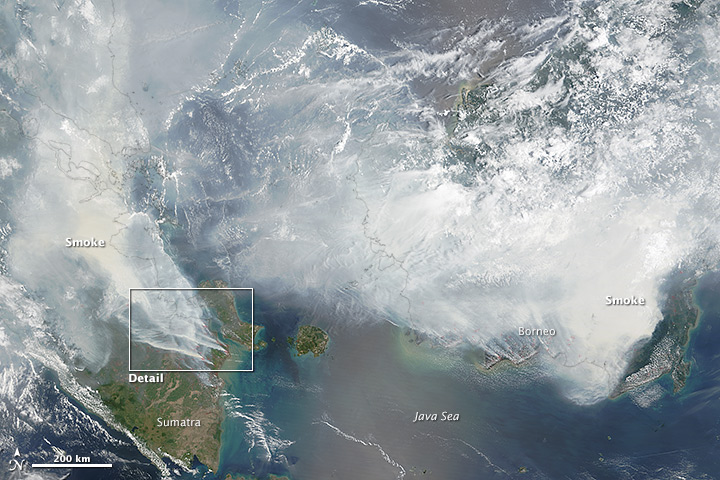
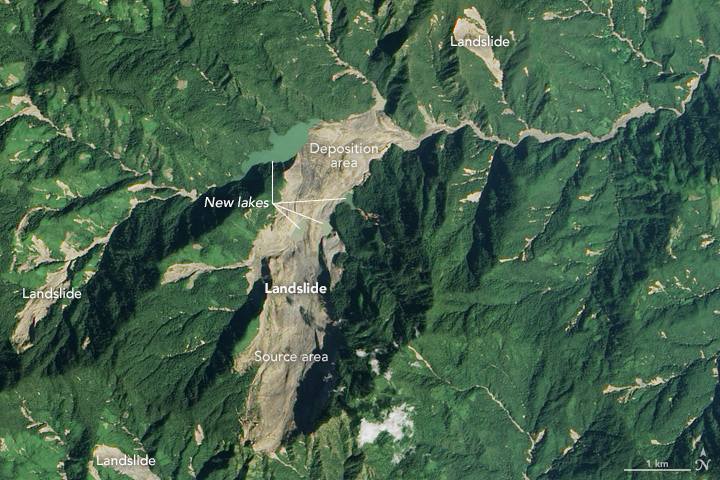
Huge slabs of Arctic permafrost are slumping and disintegrating, sending large amounts of carbon-rich mud and silt into streams and rivers. Permafrost decay is affecting 52,000 square miles in Canada—an expanse the size of Alabama. According to researchers with the Northwest Territories Geological Survey, the permafrost collapse is intensifying. Similar large-scale landscape changes are evident across the Arctic including in Alaska, Siberia and Scandinavia, the researchers wrote in a paper published in the journal Geology. Arctic permafrost caps vast amounts of old, geologic methane (CH4) in subsurface reservoirs. Thawing permafrost opens pathways for this CH4 to migrate to the surface. The concentration of methane in the atmosphere has risen sharply - by about 25 teragrams per year since 2006. Sub sea methane clathrates could also be seeping out. None of these feedbacks are included in IPCC climate models. 

Melting permafrost is altering the landscape in northern Canada on a grand scale. Credit: Wikimedia
In conclusion, putting too much trust in IPCCs climate models and scenarios is NOT recommended. One should not forget that the IPCC is a political institution and subject to political leaders meddling in the science. I have per email questioned the Swedish meteorological institute that use those models and scenarios as a reference for climate change in Sweden. When I questioned the use of IPCC material due to the fact that they don't include nonlinear dynamics I got a very angry response back that I was dead wrong. Really? So its just me and lots of other international climate experts that are worried that IPCC understates risks and uses incomplete information to draw ridiculous conclusions? Like the fact the we are already committed to 1,5C and most people think its impossible to stay below even 2C. Or the fact that all the low carbon scenarios are based on assumptions of carbon sucking technologies that we haven't tested yet. I'm I really the only one that worries about this? No, of course not. Just read the recent report by David Spratt "What lies beneath - The scientific understatement of climate risks" or take a look at the video clips and you will understand why people are worried.


Thank Ice Ages for Lakes

Map of the world's lakes with surface areas of 10 hectares or more. Dark blue areas reflect the high concentration of lakes in those regions. Credit: HydroLAB, McGill University

New research from the McGill University, published in Nature Communications, maps the distribution of our planet's lakes. It clearly shows how the last ice age shaped and formed many of the 1.4 million lakes, larger than 10 hectares, that contain 15% of all the lake water in the world. Dark blue color indicates density of lakes, and as the map shows the highest density can be found in the northern hemisphere, in regions previously covered in large ice sheets. The rest of the worlds lake water, 85%, can be found in the 10 largest lakes. About half of the lakes are freshwater and the other half are salt lakes.


Global distribution of water volume stored in lakes and reservoirs with a surface area of at least 10 ha. Source: Messager et al. (2016)

If we look at individual countries (table below) we find that Canada, Russia, USA, China, Sweden, Brazil and Norway rank in the top in regards to number of lakes and area (km2). While Russia stands out with the largest volume (103 km3) due to its many deep water lakes (e.g. lake baikal and lake vostok). Thinking in terms of drinking water, volume would probably be the most important parameter. But then again, distribution, pollution and many other factors come into play when determining access to safe drinking water.

Countries with most lakes
Country
Number of lakes (103)
Area (103 km2)
Volume (103 km3)
Canada
879.8
856.5
12.6
Russia
201.2
667.4
102.2
USA
102.5
340.3
23.5
China
23.8
81.0
1.0
Sweden
22.6
34.3
0.5
Brazil
20.9
31.4
0.2
Norway
20.0
13.9
0.3

The study only focuses on mapping out lakes it doesn’t say anything about what state these lakes are in etc. What we can tell is that the distribution of lakes is very uneven, very few along the equator and plenty in the north. Since water is such a critical resource and we’re already witnessing extreme heatwaves and extended droughts along the equator (e.g. southwestern US, Middle East) people are already realising that agriculture has to shift further north to survive, as do they.

Extreme weather - the "New Normal"


Mother Nature Strikes Back

Yes it's true that an El Niño period usually brings about certain weather extremes, however, the 2015/2016 El Niño has broken all records in terms of strength i.e. heat being released into the atmosphere from the oceans. This is to be expected as the climate is getting warmer from all the carbon pollution that has altered the chemistry of the planet. Climate change acts as a multiplier effect, increasing the frequency or amplitude of extreme weather events.

I'm sure most people have read the terrible news about the massive wildfires in Alberta or the flash floods in Germany, France and West Virginia. Few, however, may have heard about the deadly heat waves in India, floods in Pakistan or failing harvests in South Africa.

Sometimes it's hard to get a grip on what climate change will do to our environments and livelihoods. It can feel distant in time or abstract. But changes are already occurring and we have to start adapting now or more people will have to flee and become climate refugees.

These two videos give a good overview of some of the extreme weather events that have struck nations around the world lately and why it's happening. It should give us all pause, make us understand the urgency of tackling and responding to a rapidly changing climate.


Melting Arctic, Mangled Jet Stream and Massive Forest Fires


Jet streams consists of bands of very strong winds which move weather systems around the globe. These have been relatively stable until recently due to a decrease in temperature gradient between the equator and north pole. Below is a satellite image of a mangled jet stream, using Earth Nullschool, creating blocking patterns that makes weather system seem “stuck”. For example, here in southeast Sweden we are experiencing record warm May temperatures (20-25 C), little rain or wind with a high risk of forest fires.  


Jet stream pattern over Europe, with warm air “stuck” over Scandinavia
.
A similar situation but much worse is occurring in Canada where massive forest fires have driven 88,000 canadians out of their homes in Fort McMurray. These people are now climate refugees and more damage is yet to come as the fire is now moving towards Alberta’s tar sand fields and could double in size due to strong winds and dry conditions. The fire cover an area as large as Hong Kong.


.
Melting Arctic sea ice causes more heat to be absorbed by the darker surface of the ocean, especially in late spring when the sun is really strong. The extra heat is then also transferred into the atmosphere. When this happens the lower layers of the atmosphere warms and expand, pushing up the higher layers and causing the jet stream to bulge. As the sea ice disappears and the atmosphere in the Arctic warms the airflow in the jet stream is more likely to loop and bulge, causing blocking events.

High pressure systems over Greenland can have the effect of blocking polar jet stream flow over part of the North Atlantic […] causing the jet stream to split into branches and bringing about all kinds of severe weather events as a result.according to Dr. Edward Hanna from the University of Sheffield.

Researchers are worried that these type of blocking events of high pressure systems over Greenland can lead to rapid melt of the ice sheet as well as causing extreme weather events over the northern hemisphere.

FrostByte, E Hanna: The Jet Stream and Greenland Warming from Climate and Cryosphere on Vimeo.

Climate-exodus from MENA

Map of the European Migrant Crisis 2015. Credit: Maximilian Dörrbecker (CC BY-SA 2.0)


Researchers from the Max Planck institute have calculated that summer temperatures in the Middle East and North Africa (MENA) could become so hot within the coming 30 years that human habitability is compromised. Hot summer days south of the Mediterranean could see temperatures around 46 °C that, together with all the desert dust and air pollution, could become intolerable and force people to migrate.

More than 500 million people live in MENA, a region that is already experiencing drought problems and conflict over water resources. The number of extremely hot days has doubled since 1970 while population has exploded, leading to overexploitation of groundwater basins. 

In a recent story by Reveal we could read how global leaders are becoming increasingly worried about water shortages. The growing water crisis in the Middle East is thought to have contributed to destabilizing the region, sparking civil unrest and war in Syria and Yemen.

According to a 2009 cable from the U.S. Ambassador in Yemen, “Water shortages have led desperate people to take desperate measures with equally desperate consequences” 

Of course, it doesn't take a genius to figure out that people become desperate when the most vital of resources for survival becomes scarce. The once arid region is turning more and more into a desert, both due groundwater depletion and shifting climatic zones. 

Even if climate change is limited to a global mean temperature increase of 2 °C warming over land will be stronger and extreme temperatures can increase well beyond +2°C. As such, heat waves and water shortages will only worsen over time as carbon emissions rise and unsustainable usage of aquifers continues. 

Climate-exodus expected in the Middle East and North Africa
In the Middle East and North Africa, the average temperature in winter will rise by around 2.5 °C (left) by the middle of the century, and in summer by around 5°C (right) if global greenhouse gas emissions continue to increase according to the business-as-usual scenario (RCP8,5)
The migration flows from the MENA region into Europe and elsewhere will most likely increase in the future as people have no choice but to move from their drying land. 

Brace for impact: Super El Niño


As I have mentioned in a previous post, 2015/16 El Niño period have shown signs of becoming stronger than the devastating 1997/98 El Niño. Now weekly measurements are showing that it indeed has passed the record high of 1997/98 with temperatures in the central Pacific of 3°C above normal. November is likely to be strongest month of the El Niño season that lasts until spring next year.

The ongoing El Niño has already caused a number of serious impacts globally. For example, warmer waters have lead to major coral bleaching events and according to the UN, 11 million children are at risk from hunger, disease and lack of water in eastern and southern Africa, while 2.3 million people in Central America will need food aid as El Niño exacerbates a prolonged drought.

Regional Impacts


South East Asia: Dryer conditions in Southeast Asia has helped fuel massive peatland wildfires in Indonesia. This has caused dense haze to cover many parts of Indonesia and neighbouring countries with serious health impacts for local populations and has released a huge amount of greenhouse gasses to the atmosphere, making Indonesia a major contributor to climate change.


South Asia: Lack of precipitation in India due to changes in the southwest monsoon has also caused dryer conditions and risk of drought with potentially serious impacts on farmers and subsistence livelihoods. Especially since India suffered a deficient monsoon, lack of precipitation, last year as well. Meanwhile in Myanmar (Burma) a Tropical Storm drenched the western region and caused a massive landslide. More than 17,000 homes were destroyed, 46 people were killed, and hundreds of thousands of people were affected by the storm.


Southern Africa: A number of countries in southern Africa are reporting below average rainfall leading to drought conditions and fears of food insecurity. South Africa is in the midst of its worst drought since 1982, with 2.7 million households facing water shortages and farmers that cannot plant crops because of lack of precipitation. Some cities have implemented water restrictions, drastically reducing the amount of water residents can use. Regional prices for staple foods like maize meal, bread, eggs and chicken are up several percentage points. “When the maize crop goes down, the circumstances for social unrest go up … This is exactly how the Arab spring in the Middle East started, said Louis Meintjes, president of the Transvaal Agriculture Union.


South America: Ecuador and Peru has suffered from flooding, extensive erosion, mudslides with loss of lives and infrastructure as well as damage to food supplies. Peru has declared a state of emergency as the country prepares itself for the worst weather system in over 60 years. Eastern Brazil is experiencing a major drought, driven by population pressure and deforestation, that could be worsened by dryer El Niño conditions. Satellite data shows the southeast of Brazil losing 56 trillion liters of water in each of the past three years - more than enough to fill Lake Tahoe. Water rationing, power blackouts and empty reservoirs in parts of the country have become a reality. More than 11,000 forest fires have been observed in the Amazonas province of Brazil this year, a 47% increase over the same period last year, according to the National Institute for Space Research. The storms that usually keep the jungles of southern Mexico and Central America wet shift northward to the southern US during strong El Niño winters. According to the World Food Program, 3.5 million people in Guatemala, Honduras and El Salvador need food aid due to drought and crop failures.


North America: According to NOAA, almost 95% of U.S. coral reefs will have been exposed to ocean conditions that can cause corals to bleach by the end of the year. El Niño has also contributed to a very active tropical cyclone season in the Western North Pacific and Eastern North Pacific. Hurricane Patricia, which made landfall in Mexico on 24 October, was reportedly the most intense tropical cyclone in the western hemisphere ever recorded. While category 5 Hurricane Patricia weakened rapidly after hitting the rugged terrain along Mexico’s Pacific coast, remnants of the storm combined with other weather systems over the Gulf of Mexico to produce heavy downpours and widespread flooding in Texas and Louisiana

El Niño conditions and disease risk

The development of these conditions also has important implications for global public health. Multiple epidemiological studies have linked El Niño events with increased incidence of disease outbreaks.


Disease
Region
Climatic influence
Cholera
Great Lakes region, Bangladesh, India (coastal), Sri Lanka, Peru
Warmer water temperatures promote bacteria proliferation; flooding causes contamination of water sources.
Dengue
Indonesia, Thailand, Pacific Islands, Australia (Queensland), Mexico, United States (southern), Colombia, Ecuador (coastal)
Water storage promotes mosquito vector breeding; elevated temperatures reduce the incubation period.Elevated rainfall promotes mosquito breeding.
Hantavirus
China (eastern), United States (southwest)
Elevated rainfall increases food availability for rodents which expands populations and may promote contact with humans.
Leishmaniasis
Brazil (eastern), Costa Rica, Colombia
Warmer temperatures or dry conditions may favor sand fly vectors or contribute to waning human immunity (e.g., via malnutrition or temporarily suppressing disease transmission).
Malaria
China (Anhui Province), India/Pakistan (Punjab), Sri Lanka, Colombia, Peru, Venezuela
Elevated rainfall promotes mosquito vector breeding and survival.
Plague
Madagascar, United States (western)
Heavy rains increase food availability for populations of susceptible rodents; cooler temperatures may increase infectious flea abundance.
Rift Valley Fever
East Africa
Flooding of dry mosquito vector habitats promotes hatching of infected eggs, vector breeding and survival.
Respiratory Illness
Southeast Asia/Indonesia
forest fires cause air pollution that may increase risk of respiratory infection

Warming Arctic, wavy jet stream and extreme weather

Evidence getting stronger

A new study, published in Nature Geoscience, adds to the growing evidence that record-breaking extreme weather events have been influenced by human-induced climatic changes in the Arctic

Jong-Seong Kug et al (2015) used observations and modeling to investigate potential connections between extreme cold winter weather over North America and East Asia last winter and historically low levels of summer sea ice in the Arctic Ocean. They found that the reduced extent of summer sea ice in the Barents-Kara Sea region influenced cold weather in East Asia, while harsh winters in North America related to warmer temperatures in the East Siberian-Chukci Sea region.

Warm conditions in these areas of the Arctic Ocean weakens the polar jet stream (stream of high-speed winds flowing west to east high up in the atmosphere) which is driven by temperature differences between the Arctic and the equator. This, in turn, makes the jet stream pattern more wavy, creating ridges and blocking weather systems so that cold (or hot) conditions get stuck over a longer time period. Which leads to more extreme weather events.

"As we watch the Arctic continue to warm and melt - with regional differences from one year to the next - the research presented by Kug et al may provide early warning of extreme winter weather in heavily populated areas of the northern hemisphere, thereby saving energy and lives" says researcher Jennifer Francis in an interview with the Carbon Brief.

These changes to jet stream patterns are believed to be responsible for Californias long standing drought conditions and record cold winters in eastern United States. This summer parts of Alaska experienced really warm weather that lead to major forest fires, and some 30 whales washed up dead on their shores. Probably due to warmer waters and loss of food supply (krill).
The jet stream, which once used to move over North America horizontally, has become more wavy, pushing warm air north on the left, while drawing cold air from the Arctic south on the right. Source: Arctic News blog
It also influences weather patterns in Europe, causing record  floodings and storms in the UK and warmer weather in central Europe, this year leading to a record drought (loss of soil moisture) that negatively impacted crop yields.

Omega wind heatwave June 28- July 04, 2015. Credit: NOAA

Welcome to +1℃ warmer Earth

+2℃

This is the limit to average global temperature rise that the world has decided we should not cross this Century in order to prevent dangerous climate change. Some think of it as the safe limit despite many scientists warnings that we should really stay below 1.5℃ since two degrees would most likely have devastating consequences (Hansen et al. 2013; Hansen et al. 2015).

+1℃

This is the amount of average global warming that we are now (2015) experiencing, according to the latest data from NASA. The recent reading is the first to show a consistent break at 1℃ above 1880s levels and is a scary milestone towards the catastrophic 2℃ we really want to avoid.

NASA’s geographic temperature anomalies for a record hot June in 2015. Source:NASA GISS.

The map above shows June temperature anomalies. We can see that there are large areas of 2-4℃ (orange-red) above average readings, mostly located in the Northern Hemisphere. Alaska, western Canada and western Asia has the highest readings. On average we can also see that most of the globe is at least 1℃ above normal, the exceptions being parts of the Atlantic ocean south of Greenland, Scandinavia and the South pole. This illustrates how one degree warming actually means a lot of different conditions around the globe. We have had heat waves in India and Pakistan, massive forest fires in western US and Canada and record breaking heat in parts of South America. But I’m afraid that most Swedes can only think of the rainy summer we are currently experiencing, which runs opposite to the global trend.

For those who don’t think +1℃ is such a big deal, lets look at some climate refugee statistics. Only 40 years ago, Earth’s climate was more stable with less extreme weather, when average temperatures were only 0.5℃ cooler than today. Mainly because there was less available heat energy to pump up storms and melt the polar regions, which is now impacting global wind patterns. We now live in a more dangerous world with a climate system more prone of producing extreme and disruptive weather events.

According to the Internal Displacement Monitoring Agency (IDMA) every person on Earth is now on average 60% more likely to be forced out of their homes by natural disasters, compared to 1975 (population growth accounted for). This is a staggering increase! Over the past 7 years some 158 million people have been forced to flee their homes due to natural disasters. In 2014, 92% of the total or 17.5 million people were forced to flee due to extreme weather events. The typhoons and floods in the Philippines and India ranking as the worst. Between 2008-2014, floods (55%), storms (29%), Earthquakes (14%) and extreme temperatures (1%) were the most common natural hazards leading to displacement. East Asia and the Pacific, which are densely populated developing regions, have been worst impacted.
Since 2008, an average of 26.4 million people have been displaced from their homes each year by disasters brought on by natural hazards, equivalent to one person displaced every second. Source: IDMC 2015

Strange summer extremes around the globe

Forest fires, heat waves and heavy precipitation events

In June this year we saw record heat in South America and Western United States but the weather here in Scandinavia has been very rainy and a bit cold this summer. How come? 

The heat wave that struck Pakistan in June resulted in many deaths and temperatures reached 40-44 degrees Celsius in Portugal and Spain at the end of the month. As we can see on the map below, some regions of the world have experienced high temperature anomalies for June. Venezuela, Argentina and Colombia noted new heat records, and massive forest fires have been burning in Canada and Alaska, while we here in Scandinavia have experienced a very rainy summer. It's like weather patterns are getting stuck, perhaps they are?

Source: SMHI (2015)

Changing wind patterns

That is at least one credible theory discussed by Francis & Vavrus (2015). According to the authors new metrics and evidence support a linkage between rapid Arctic warming, relative to Northern hemisphere mid-latitudes, and more frequent wavy jet-stream configurations that favour persistent weather patterns. Results suggest that as the Arctic continues to warm faster than elsewhere on the planet in response to rising greenhouse-gas concentrations the frequency of extreme weather events caused by persistent jet-stream patterns will increase. In that context, heat waves in Pakistan, forest fires in Alaska and Canada and heavy precipitation events in Scandinavia makes sense. Because the temperature gradient between the north pole and the equator has decreased, as more ice melts due to warming, wind patterns start forming more strange patterns that tend to “get stuck”. 

The Arctic has warmed approximately twice as fast as the Northern mid-latitudes since the 1990s, a phenomenon known as Arctic amplification. This disproportionate temperature rise has influenced large wind circulation patterns, i.e. the polar jet stream, slowing them down. In areas and seasons which temperature gradient have weakened due to Arctic amplification we can now observe wavier and meandering jet-stream patterns.

Changing Ocean Currents

In another study Moore et al. (2015) points out that the loss of sea ice in Greenland and Iceland Seas is affecting the production of dense water that forms the deepest part of the Atlantic ocean current (AMOC) that carries warm water from the tropics northward to Europe and the North Atlantic and cold water southwards. The authors state that this could potentially lead to colder climate in northwest Europe.

Because the Greenland Sea provides much of the mid-depth water that fills the Nordic Seas the observed change in ocean mixing, from once deep mixing to now only shallow mixing, could potentially change the temperature and salinity characteristics of these seas. A slowing down of the Atlantic ocean mixing currents could have dramatic impacts on the climate of the North Atlantic and western Europe. In particular, it would reduce the volume of warm water transported at the surface towards western Europe. More research is needed before we can really understand how the slowing down of North Atlantic ocean currents could impact European climate. But one thing is sure, we are experiencing some weird climate these days and we have only warmed the planet to about 0.85 degrees Celsius, imagine what 2 degrees would be like! 

Record Warming 2014

Global temperatures January-October


According to the US National Oceanic and Atmospheric Administration (NOAA) the first ten months of 2014 (January-October) were the warmest such period since record keeping began in 1880. Global land and ocean average surface temperature reached 0.68 °C above the 20th century average of 14.1°C. Making 2014 on track to become the warmest year on record. Record warmth for the year so far has been particularly notable across much of northern and western Europe, parts of far east Russia, and large areas of the northeastern and western equatorial Pacific Ocean.

Source: NOAA, 2014

Sweden was warmer than average during October, with the southern half of the country experiencing temperatures 2-4°C above their October averages (SMHI). On October 28, the daily temperature in Stockholm was 14.2°C, the highest daily average observed so late in the year since records began in 1756. 

Northern Hemisphere is warming faster

Looking at historical records  of Land and Ocean surface mean temperature anomalies we can see that the northern hemisphere is warming much faster, with some of the most rapid warming rates on Earth located in the Arctic, where sea and land ice is shrinking and thinning.

Source: NOAA, 2014
Changes in albedo (i.e. reflectivity) difference between the Arctic and Antarctic and global ocean currents contribute to the Northern Hemisphere’s rapid warming, according to researchers from Potsdam Institute for Climate Impact (Feulner et al. 2013). Currents transport heat away from southern waters and into the North Atlantic and North Pacific, helping to warm nearby land areas in the north even more. For example, the Gulf Stream, which carries heat from the tropics far into the North Atlantic, along the Scandinavian west coast (see map).


Source: Tellus

Melting Arctic = More Extreme Weather?

Temperatures in the Arctic have risen twice as fast as the rest of the world, a phenomenon known as Arctic amplification (Cohen et al. 2014). Scientists have linked the rapid rise in Arctic temperatures over the past two decades to weather extremes in the Northern Hemisphere such as heatwaves in the US and flooding in Europe (Coumou et al. 2014, Francis 2014). Rapid warming in the Arctic can have triggered changes to global wind patterns, which have brought extreme weather to lower latitudes. Extreme weather events have almost doubled over the last two decades. Now researchers think that this can be linked with unusual weather patterns in the upper atmosphere, influenced by warmer Arctic temperatures. They believe that the loss of sea ice in the Arctic may be contributing to the appearance of wide north-south swings in the high-altitude winds flowing globally west to east around the polar region, causing them to “get stuck” and amplified in a quasi-stationary pattern known as a “standing wave”. When interviewed by the Independent one of the researchers, Stefan Rahmstorf, said “Evidence for actual changes in planetary wave activity was so far not clear. But by knowing what patterns to look for, we have now found strong evidence for an increase in these resonance events” (Professor of Physics and co-chair of Earth System Analysis at Potsdam University). The possibility of a link between Arctic change and mid-latitude weather has spurred research activities that reveal three potential dynamical pathways: changes in storm tracks, the jet stream, and planetary waves and their associated energy propagation (Cohen et al. 2014).

Changes in precipitation

A study from Berkeley has projected that if emissions remain on their present upward trajectory, the average temperature difference between the two hemispheres could be about 1.6°C. This would be sufficient to alter tropical rainfall patterns, which could affect everything from rice cultivation in India to the health of the Amazonas Rainforest (Friedman et al. 2013). According to the authors, tropical rain bands that form near the equator where trade winds collide to build up thunderstorms may shift northward, drying out parts of the Southern Hemisphere, while causing more precipitation in the North.