Showing posts with label risks. Show all posts

Climate hazards too much for the current governance paradigm to handle


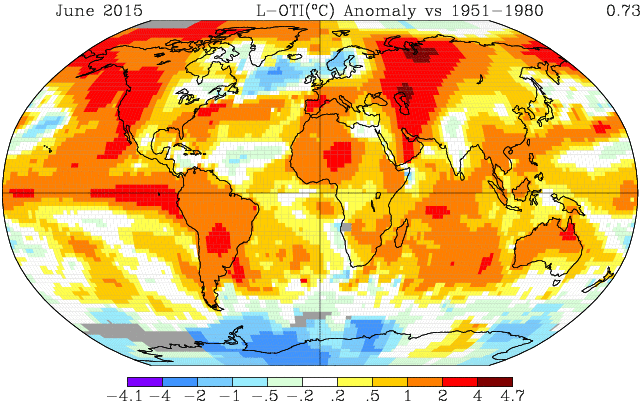
Life on Earth is under enormous stress from a rapidly changing environment and climate. A recent study in Nature show how human societies are already impacted by a changing climate in at least 467 different ways. For example, increased water evaporation and increased air capacity to hold moisture, due to warming, have lead to extreme drought in places that are commonly dry (California, Middle East and Southwest Asia) that have lead to higher risk of heatwaves and wildfires. Warmer ocean waters enhances evaporation and wind speeds thus intensifying downpours and the strength of storms and risk of flooding from storm surges aggravated by sea-level rise. 

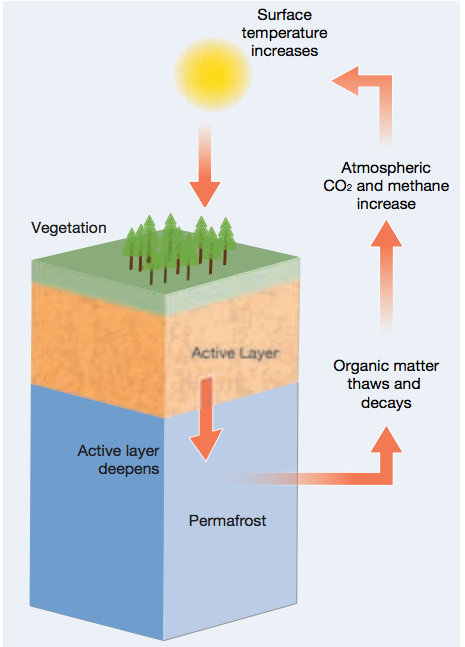
The cumulative changes from a disrupted climate are so massive and the speed at which they are occuring so rapid, only comparable to when a meteorite killed the dinosaurs som 65 million years ago, that many species will have a hard time adapting. Species must either tolerate the change, move, adapt, or face extinction. We know that species on land are moving polewards by 17 km per decade and marine species 72 km per decade. And just like terrestrial mountainside species are moving upslope to escape warming lowlands some fish species are driven deeper as the sea surface warms. This in turn impacts human well-being and is already forcing people to migrate.


The current socio-economic paradigm has not changed in accordance with occuring biophysical changes and will not be able to handle the mounting pressure unless it adapts or transforms into something new. A rapidly changing world cannot be navigated by concentrated, rigid, hierarchical, short-term social systems that resist change and tries to maintain status quo. We know this to be true of all living systems, including human societies. Civilisations fail to adapt to changing environmental conditions because they try to maintain high levels of sociopolitical complexity (large armies, bureaucracies, social stratification, occupational specialisations) and focus on expansion instead of dissolving into decentralized, smaller, more flexible and innovative units that are able to respond to change more effectively. That's why corporations, with global scope, are doing better than nation states. And why local communities and municipalities are responding more effectively to changes than governments. 

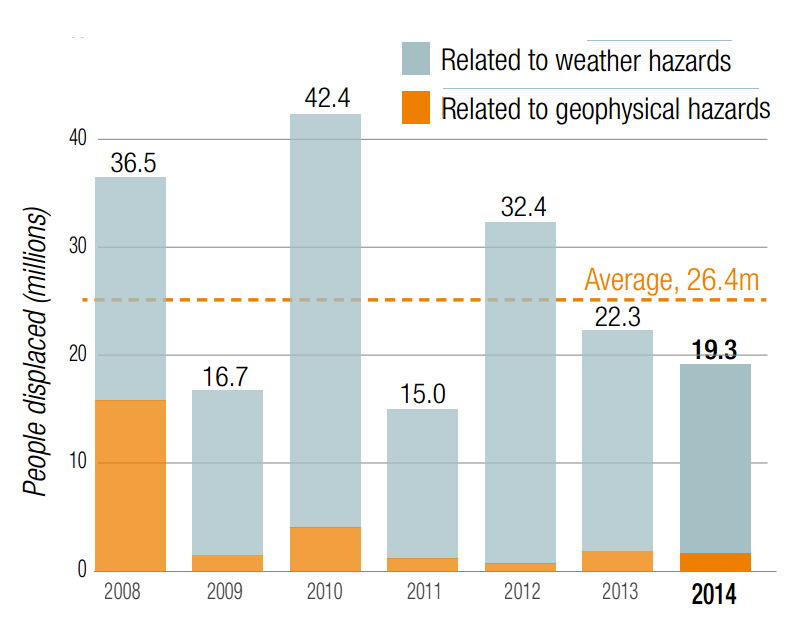
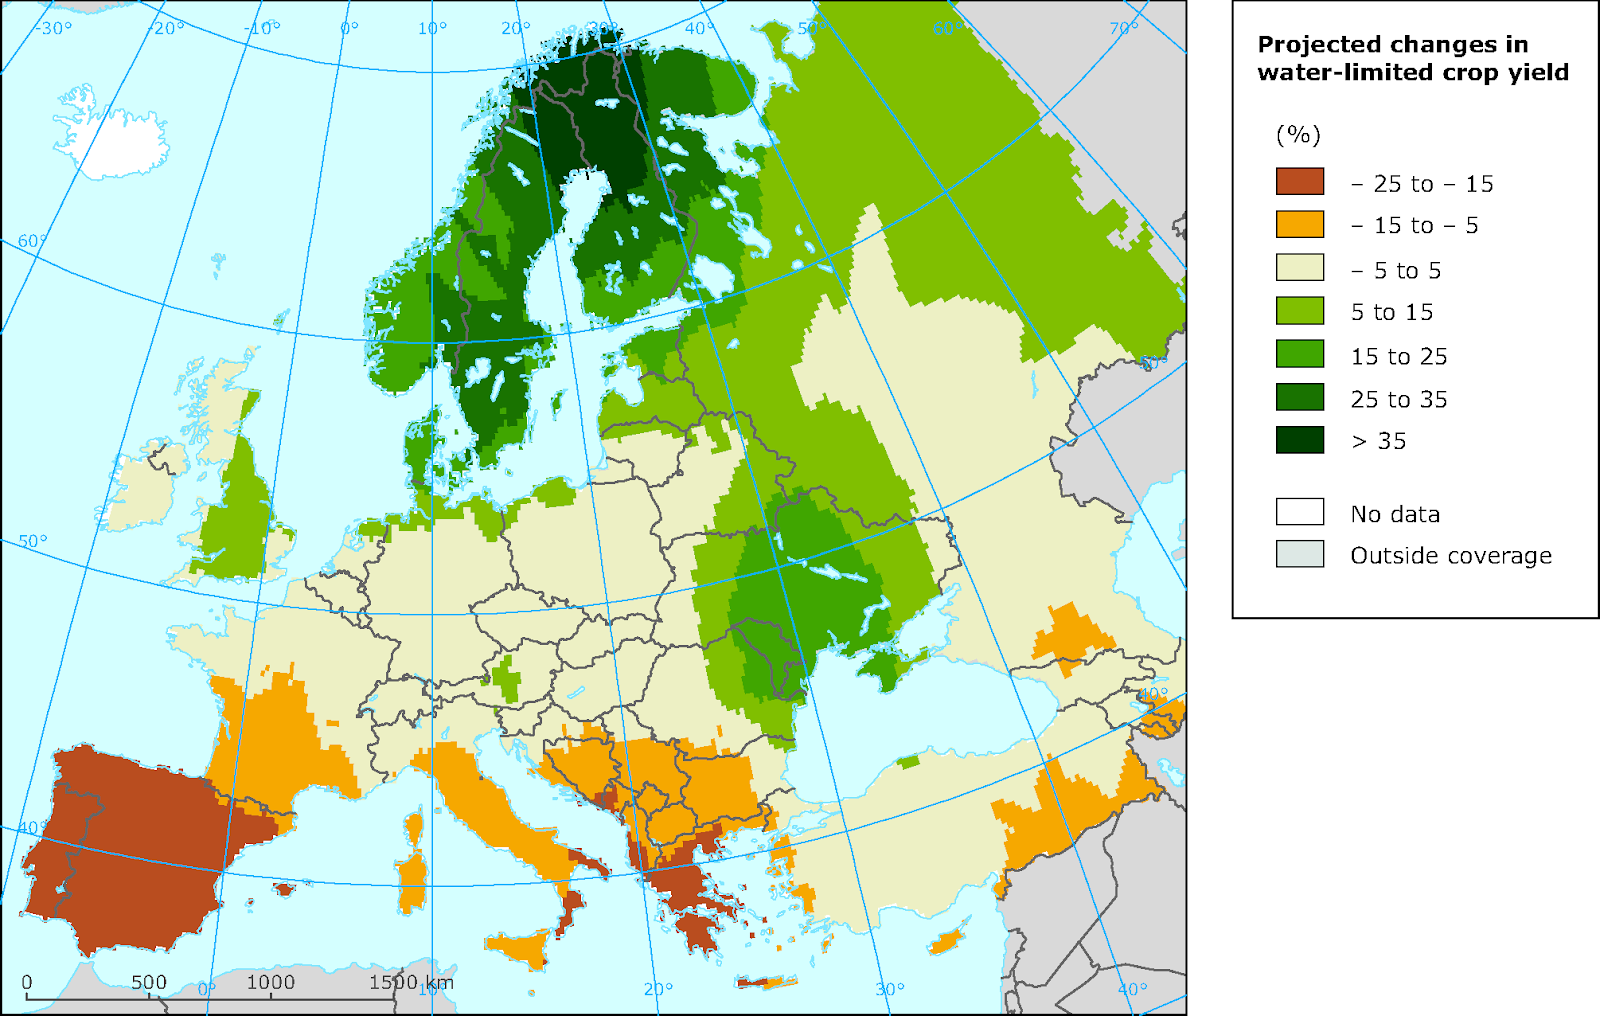
However, the limiting conditions, resource availability, under climate change make adaptation in place difficult since entire regions are becoming increasingly uninhabitable. Thus forcing people to migrate, just like other species do. This in turn puts extra pressure on national governments as social tensions increase over remaining resources. States that fail to provide essential services for their citizens eventually foster uprisings and risk internal conflict and collapse. We already see this occuring in the Middle East (Syria, Yemen, Iraq, Isreal/Palestine, Egypt). 

Unless governments take seriously the need for fundamental change of the sociopolitical system they will be unable to handle to shift to a post-carbon society able to cope with climate change. Trying to expand and pile on further sociopolitical complexity to the system will not work.
Climate Hazards

Eating fossil fuels - Failing food security

Silage windrows in a field in Brastad, Lysekil Municipality, Sweden. Credit: W.Carter (CC0 1.0)

Multiple stressors are converging to make the current industrial food system increasingly unsustainable and vulnerable to perturbations. Of course, the food system is in and of itself a leading cause to what is now threatening its future survival. Climate disruption, freshwater depletion, biodiversity loss, soil erosion and falling EROI on fossil fuels all point to the demise of industrial agriculture. This is well understood by biophysical economists and systems ecologists but often neglected in public or political discussions about food security. Most agricultural policies worsen the problem by making small-scale local agroecological farming unprofitable. Thus dooming large swathes of the population to become reliant on a dying system that costs more than it provides in terms of surplus energy.

There is a big misconception in the world about how modern technology has made us more efficient in agriculture. We think that big machines and lots of fertilizers are a better use of resources than employing more people. While large scale farming may seem efficient at first glance our perceptions are opposite of reality. How efficient the production of food is depends on the amount of energy expended on its development. The EROI, Energy Return on Investment, shows us the true nature of our efficiency in producing and consuming food. 

In hunter-gatherer societies, the relevant EROI metric is the caloric value of the food captured or gathered, versus the caloric expenditure of the hunt or gathering expedition. Studies of hunter-gatherers show an EROI of 10:1 to as high as 50:1 (Glaub 2015, Glaub & Hall 2017) depending on effort and final consumption. Large prey eaten directly by the hunting party only would yield a large energy profit while meat provided to support the hunters families would yield lower EROI ranging between 16:1 to 6:1. Nevertheless, this relatively large energy profit ratio probably allowed for the leisure time often associated with gathering societies. But limited capacity for food storage and settlement hinders development of a larger society. 

High population and overexploitation of resources was likely a driver of early domestication. In pre-industrial agriculture, dependent on peasant farmers, the EROI was 5:1 or less (Day et al. 2018) as it required intense efforts over long periods with often variable results. Much time was spent on production of food, fodder and fuelwood. But farming had the benefit of food storage which led to established settlements and concentrated labour. Fuelling population growth and specializations. 

Early industrialized societies benefited from high EROI from fossil fuels and large energy surpluses. Capital and energy substituted for labour. Food, fodder and fuel could be provided with fewer workers, permitting an expansion of non-primary sectors. The range of goods and services expanded. In the United Kingdom, energy and food expenditures fell to 20% as a proportion of GDP in 1830 from 50-80% prior to the industrial revolution (Day et al. 2018). But EROI of global oil reached its maximum value of 50:1 in the 1930s and has fallen since then to about 10-15:1 today (Court & Fizaine 2017). Modern industrial high-tech agriculture now consumes a staggering 10 calories of energy for every calorie of energy (food) delivered to the market, i.e. EROI of 1:10. Rending much of agriculture a net energy loss and completely unviable without fossil fuels.

As EROI of fossil fuels continues to fall an increasing amount of energy will be needed simply to provide energy and food to society. Leaving less energy over for other sectors of the economy such as education, health care etc. The only way to get out of this trap is to switch to renewable energy sources and promote small-scale, local, agroecological food production that can generate high yields but in a more diffused manner. Just like renewable energy technologies. Thus there needs to be a transition from centralised to decentralised energy and food production. Very few believe we can replace all fossil fuels with biofuels or electricity, especially in the agricultural industry that is very reliant on diesel as transport fuel. Furthermore, even if some farms could make such a shift in fuel use they would still be unsustainable if they continue to erode soils, eradicate biodiversity, deplete freshwater sources and pollute the environment. Even FAO recognizes this dilemma and now promotes agricultural practices in line with ecosystem-based management

Chronic illness major cause of premature deaths

The probability of dying from chronic illness between 30 and 70 years of age. Credit: NCD Countdown 2030


If you live in the US, China or UK you have a higher risk of dying early from chronic illnesses like cancer, cardiovascular disease, chronic respiratory disease and diabetes than people in Australia, Japan, Spain or Sweden. These are some of the findings in a detailed global analysis of deaths related to non-communicable diseases (NCD). The study is a collaboration between the Imperial College London, World Health Organisation and NCD alliance.

Chronic illnesses are the main cause of premature death for most countries and a larger danger to human health than traditional foes such as bacteria or viruses. Non-communicable diseases kill nearly 41 million people every year, about seven out of ten deaths globally, of which 17 million of these deaths are classed as premature (i.e. before the age of 70). 

Overall, women in Spain, South Korea, Japan and Switzerland were least likely to die prematurely from chronic illness while the lowest risk for men were Iceland, Sweden, Norway and Switzerland. 

According to the analysis, the situation is stagnating or deteriorating in 15 countries for women and 24 for men. A multitude of factors such as alcohol and tobacco use, pollution, stress and lack of sleep, diets and exercise, early treatment etc could be contributing to increases in chronic illnesses. 

In Europe, women in Moldova (17%) and Ukraine (16%) have the highest chance of dying from key NCD and the lowest chance in Spain (6%) and Switzerland (7%). For men i Europe, the highest chance is seen in Russia (37%) and Belarus (35%) and the lowest chance in Iceland (10%) and Switzerland (11%).

The chances for men and women in the US to die prematurely of NCD is worse than in Vietnam, Turkey, Panama, Liberia, Mexico and Angola. In other words, the highest risk among all high-income nations.

Extreme drought in Europe worst since 2003

This years summer (April-July) in central Europe have been one of rainless weeks and relentless heat, as expected from climate models. Similarly to the summer of 2003, a large part of the continental EU was affected by a severe drought in June and July 2015, as a consequence of the combination of rain shortages and very high temperatures which resulted in high plant water requirement (evapotranspiration) levels. France, Benelux, Germany, Hungary, the Czech Republic, northern Italy, and northern Spain experienced particularly exceptional dry conditions.

Agricultural production has suffered in large parts of central France, south-central Germany and into Poland, Hungary, Ukraine and southwards into northern Italy and Spain. Grain harvests in Germany have fallen 11% and apple harvests 21%, while France expect a 28% drop in corn output. Record low river water levels in Poland have revealed Jewish tombstones and Soviet fighter planes, as well as human remains from the second world war. 

Some parts of Germany have the lowest levels of soil moisture since records began in 1951. Restrictions to industrial and civil water use have been imposed. Monthly rainfall averages fell by as much as 80% in parts of France and northern Spain experienced daily temperatures over 30 degrees for more than 40 days.

Areas with the lowest soil moisture content since 1990 in July 2015 (in red) and in July 2003 (in blue). Source: European Drought Observatory

Welcome to +1℃ warmer Earth

+2℃

This is the limit to average global temperature rise that the world has decided we should not cross this Century in order to prevent dangerous climate change. Some think of it as the safe limit despite many scientists warnings that we should really stay below 1.5℃ since two degrees would most likely have devastating consequences (Hansen et al. 2013; Hansen et al. 2015).

+1℃

This is the amount of average global warming that we are now (2015) experiencing, according to the latest data from NASA. The recent reading is the first to show a consistent break at 1℃ above 1880s levels and is a scary milestone towards the catastrophic 2℃ we really want to avoid.

NASA’s geographic temperature anomalies for a record hot June in 2015. Source:NASA GISS.

The map above shows June temperature anomalies. We can see that there are large areas of 2-4℃ (orange-red) above average readings, mostly located in the Northern Hemisphere. Alaska, western Canada and western Asia has the highest readings. On average we can also see that most of the globe is at least 1℃ above normal, the exceptions being parts of the Atlantic ocean south of Greenland, Scandinavia and the South pole. This illustrates how one degree warming actually means a lot of different conditions around the globe. We have had heat waves in India and Pakistan, massive forest fires in western US and Canada and record breaking heat in parts of South America. But I’m afraid that most Swedes can only think of the rainy summer we are currently experiencing, which runs opposite to the global trend.

For those who don’t think +1℃ is such a big deal, lets look at some climate refugee statistics. Only 40 years ago, Earth’s climate was more stable with less extreme weather, when average temperatures were only 0.5℃ cooler than today. Mainly because there was less available heat energy to pump up storms and melt the polar regions, which is now impacting global wind patterns. We now live in a more dangerous world with a climate system more prone of producing extreme and disruptive weather events.

According to the Internal Displacement Monitoring Agency (IDMA) every person on Earth is now on average 60% more likely to be forced out of their homes by natural disasters, compared to 1975 (population growth accounted for). This is a staggering increase! Over the past 7 years some 158 million people have been forced to flee their homes due to natural disasters. In 2014, 92% of the total or 17.5 million people were forced to flee due to extreme weather events. The typhoons and floods in the Philippines and India ranking as the worst. Between 2008-2014, floods (55%), storms (29%), Earthquakes (14%) and extreme temperatures (1%) were the most common natural hazards leading to displacement. East Asia and the Pacific, which are densely populated developing regions, have been worst impacted.
Since 2008, an average of 26.4 million people have been displaced from their homes each year by disasters brought on by natural hazards, equivalent to one person displaced every second. Source: IDMC 2015

Committing to several meters of sea-level rise?

Projected sea-level rise of 5 meters in western Europe. Source: Rowley et al. (2007)

New research indicates we could be heading for 6 meters of sea-level rise

Researchers part of the international Past Global Changes project, have analysed sea levels during several warm periods in Earth's geological past when global average temperatures were similar to or slightly warmer than today (~1C above pre-industrial levels) (Dutton et al. 2015). The team concluded that during the last interglacial, a warm period between ice ages 125, 000 years ago, the global average temperature was similar to the present and this was linked to a sea-level rise of 6-9 meters, caused by melting ice in Greenland and Antarctica. And 400,000 years ago sea-levels rose 6-13 meters. 

What is scary about these two periods is that carbon dioxide in the atmosphere remained around 280 parts per million (ppm). The research group also looked at sea levels during the Pliocene, 3 million years ago, when carbon dioxide levels reached around 400 ppm, similar to today's levels. According to the scientists, sea levels were at least 6 meters higher than today. This could happen to us, but surely it would take a long time, right?

Risk of rapid sea-level rise

Well, in another recent study a group of 17 scientists describes a scenario where the world oceans rise much faster than models have predicted (Hansen et al. 2015). The study basically points out that a 2C global average rise in temperature, a political limit to induced warming, would result in a rise of the world's oceans to dangerous levels. The team looked at what happened during the Eemian period when atmospheric temperatures were approximately 1C warmer than they are now and found that ocean levels were much higher than they should have been based on modern climate models. The explanation for this could be that even a small climate forcing could set in motion reinforcing feedback loops in the climate system. In this case, warming led to a small amount of ice sheet melt, which changed ocean currents, which melted more ice. Such complex dynamics are not well incorporated into modern climate models.

Sea-level rise is speeding up. Source: Hansen et al. 2015

Hansen and colleagues conclude that humanity faces near certainty of eventual sea level rise of at least Eeemian proportions, some 5-9 meters, if fossil fuel emissions continue on current trajectory. This would mean that coastal cities and low-lying areas such as Bangladesh, European lowlands, and large portions of the United States eastern coast and northeast China plains could be completely lost or almost impossible to protect. If reinforcing feedbacks kick in then rapid sea level rise could beigin sooner than most models assume. If the Southern Ocean subsurface warming of the Antarctic ice sheets continues to grow we will probably not be able to avoid sea level rise of several meters. And it could happen over decades, not centuries. But this is highly uncertain. What we do know is that we are on a very dangerous climate trajectory and time is running out to change course.

Transgressing Planetary Boundaries

Are humans shifting the entire Earth system?

The diagram shows the nine planetary boundaries. Source: Steffen et al. (2015), Design: Globaia

Four out of nine Planetary Boundaries (PB), beyond which humanity runs the risk of major environmental crisis, have to date been transgressed. These include: genetic diversity, climate change, biogeochemical flows and land-system change. That is the message of a large group of scientists, lead by Will Steffen, who recently published their improved estimation in the journal Science

The concept planetary boundaries was first used in the original paper from 2009, in which Rockström et al. identified nine different natural processes that are critical for the stability of the Earth system. In that paper they also estimated boundaries, parameters of change, within which humanity would like to stay to ensure long term progress and survival.

By transgressing four out of nine boundaries humanity is now on the verge of shifting the entire Earth system, from a friend with predictable and temperate climate full of diversity to a foe with unpredictable and warmer climate with less diversity. For example, large marine ecosystems could change dramatically due to ocean acidification and eutrophication, higher temperatures could threaten agricultural productivity and human health, and continued loss of biodiversity could mean faster spread  of diseases and pests.

Steffen explains that once we have passed a threshold it becomes increasingly difficult to turn back or even slow down changes in the Earth system. In other words, it could potentially have catastrophic consequences. The authors have named two of the nine PBs "core" since they are fundamental to the integrity of the Earth system. These two include climate change and biosphere integrity, and we have basically passed both of those two boundaries.   

Emotion = Action


We are emotional apes

Emotions are produced and experienced in the brain's limbic system (middle). Emotional impulses travel from the limbic system to the frontal cortex (front) where rational, logical thinking can take place. Neuroscientist have found that its the emotional part of our brain that moves us into action. Understandably, since we have evolved to respond to immediate threats that requires a quick response or single action. However, this is a major hindrance when it comes to solving problems such as climate change, that are complex, "invisible" and happen over long timescales. Environmental scientist have tried for decades to engage people in the climate change problem, but much indicate that they have not been very successful. On the other hand, many people probably understand the central problem of pollution but in this case there is no silver bullet and we have to cooperate on a global scale. That makes us feel like we have no agency. So we need leadership and good examples. 

This is not a Hollywood movie

In most action movies there is always someone who comes to the rescue. But in this case, it is not so. Poor leadership, too little civil society engagement, entrenched business interests and daily distractions keep us on the path of “business-as-usual”, despite our better judgement. We cannot wait any longer, we need to make our voices heard.


In Sweden, 3 out of 5 top worries among the public are related to environmental problems. Yet, last election no political party really talked about their vision of a more sustainable society or how to get there. We have to make some crucial decisions regarding: nuclear power, emergency response capacity, climate adaptation funding, transportation, flood protection, supply chain security and more. Planning for and adapting to changes takes time and replacing infrastructure or energy supply sources takes decades. If politicians are serious about reforming immigration policy they should focus on our climate dilemma, since if we fail to take action, there will be millions of climate refugees from poorer nations and perhaps even war and conflict. This fact is seldom talked about. We can only hope that the re-election engages people more than the last election, which was very dry and lacked clear topics.

The Lima Accord: Some key points

Typhoon Hagupit. Source: NASA

The climate is already changing


One year ago, supertyphoon Haiyan unleashed havoc in the Philippines while world governments were discussing a global climate agreement at the United Nations Climate Talks. Now, one year later, another destructive typhoon Hagupit hit the country while the same climate negotiations were taking place in Lima, Peru. While no single storm can be directly linked to a changing climate, the increased frequency and intensity of severe storms, has been observed and reported on by scientists linking it to global warming. Some politicians and businesses herald the Lima talks as progress while many climate experts say it’s not enough. Let’s look at some of the issues with the draft agreement coming out of Lima. 

The Lima Accord: Some key points

First, the new agreement does not reflect the urgency of the climate crisis. One of the fundamental flaws of the negotiations is the lack of a clear global goal for limiting global warming based on science. The IPCC latest report made it clear that we have to get off fossil fuels and take urgent measures if we want to keep warming below 2 degrees Celsius and avert global disaster (its even debatable if 2C degrees can be considered a "safe" limit). With the current agreement we are on a path to 3-4 degrees warming. Island nations face imminent danger from rising sea-levels but the agreement does not reflect this urgency. 

Second, while there are some good ideas in the agreement there are no measures to ensure implementation. One scenario included in the text coming out of Lima is a goal of phasing out carbon emissions by 2050, which was supported by over 100 countries. This is a big deal. However, the only way to achieve it is by moving away from fossil fuels but there is still no plan for how countries will achieve this or how to monitor their progress. Each country are expected to report in the coming months how they will make this happen. But nations won’t be held accountable for reporting their plans. This increases the seriousness of putting pressure on governments to ensure responsibility. 

Third, many least developed and vulnerable countries feel they have been left out in the cold. The agreement does not force rich nations to support countries that are being most impacted by climate change. Countries that have had little impact on global emissions will likely be the ones making the most efforts to create change but they will not be getting enough financial support. It’s a serious issue of climate injustice. Many rich countries are still treating the climate talks as business as usual and are not going out of their way to provide leadership. 

Fourth, the world’s nations are for the first time in agreement over that poorer nations should also lower their emissions. How much rich nations and poorer nations should lower their emissions, respectively, has not been agreed upon. This will be a difficult issue to solve during the 2015 Paris meeting. 

Conclusion

The Lima Accord resulted in that every nation has to present their emission plans during March 2015. The final text also opened up for the future agreement to be non-binding and voluntary, which most experts agree on is a bad idea. The major questions around how poorer nations will receive financing and technology as well as payments for losses and harms from a changing climate has not been resolved. Richer nations seem to once again have gotten their will while the poorer nations are the loosers. The issue of climate justice has thus not been adressed which was the major problem during the Climate talks in Copenhagen. It looks like most problems are pushed further down the road, to the climate meeting in Paris, November 2015. I have no major expectations since politicans has proved over and over again that they are incapable of coming to an agreement with teeth. We will have to look for other solutions that incurage low-carbon solutions and forces emitters to pay, for example, through dividends and fees on carbon from all trade and production.

Why you should care about the Arctic

Arctic Sunset. Wikimedia Photo: P J Hansen 

The Arctic is Warming


Rising temperatures in the Arctic are contributing to melting sea ice, thawing permafrost, and destabilization of a system also known as “Earth’s Air Conditioner”. The Arctic regulates ocean and atmospheric circulation and keeps the the planet cool. Climate change is impacting weather patterns, natural systems, and human life around the world. The Arctic, however, is central to these impacts as it is warming more rapidly relative to lower latitudes, about twice as fast as the rest of the globe, making it “the canary in the coal mine”. What happens in the Arctic is of utmost importance to us humans if we want to know how climate change will impact our only home, planet Earth.

Reinforcing feedbacks and potential tipping points


The Arctic is very sensitive to global heat forcing, and any small warming there could rapidly trigger a number of feedbacks that generate more warming for the Arctic and the globe. These feedbacks include but are not limited to: A) snow and ice melting; B) changes in ocean and atmospheric circulation; C) thawing permafrost and methane release. The concept of a “tipping point” - a threshold beyond which a system shifts to an alternate state - has become familiar to most people concerned with the climate debate. If tipping point means crossing a critical threshold in which a system enters substantial, potentially irreversible, change that causes it to move into an entirely new state, there may be precursors or early warning signals of such change. Such warnings are exactly what climate researchers and ecologists are looking for and trying to map out. The graphic below shows potential tipping elements in the Arctic region.

Map show potential tipping points in the Arctic region: ice melting (white); ocean and atmospheric circulation (aqua green); and biome changes (dark green).
Source: Lenton (2012)
Snow & Ice melt

greenland_ice_sheet_reflectivity_2012.png
Source: meltfactor.org
As snow and sea ice retreat, exposing land and sea with lower albedo (i.e. less reflectiveness), more solar energy is absorbed, thus leading to further melting and retreat in a vicious cycle. The present thinning and retreat of Arctic sea ice is one of the most serious geophysical consequences of global warming and the rate of ice melting have greatly exceeded the predictions of most models (Wadhams, 2012). Experts suggest that we may have, in 2007, passed a tipping point towards having sea-ice free summers in the Arctic (Livina and Lenton, 2013). Some studies suggest that the Arctic could have sea-ice free summers in only a couple of years, 2016-2020 (Maslowski et al. 2012; Wadhams 2014) while others predict it to occur later, around 2041-2050 (Cawley 2014Liu et al. 2012) given continued warming. Eighty-one percent of Greenland, which is located mostly inside the Arctic Circle and is the world’s largest island, is covered by ice. The Greenland ice sheet is currently losing mass at a rate that has been accelerating (Lenton, 2012). And in July of 2012 Greenland ice sheet reflectivity at 2000m-2500m collapsed during the summer (figure 1). In a study published in Nature Reyes et al. (2014) argued that between 4.5 and 6.0 meters of sea level rise 400,000 years ago could be attributed to a collapse of Greenland's southern ice sheet. Data from marine records in the North Atlantic show that the average temperatures in Greenland during that period were only about 1°C warmer than today’s temperatures. The similarity in climate between then and now “suggests the threshold for ice sheet collapse is pretty low”, according to one of the co-authors, “We could be nearing the tipping point” (Oregon Live, 25th June 2014).

Changes in ocean and atmospheric circulation

In recent years radical shifts in atmospheric circulation patterns have occurred in the Arctic, strengthening poleward heat transport and bringing warm air and warm ocean currents from the Atlantic right into the centre of the Arctic (Lenton, 2012). This behavior in wind and water circulation limits winter sea-ice growth and thus contributes to further summer sea-ice decline. The additional warming in the Arctic affects weather patterns in the Arctic and beyond by altering the temperature gradient in the atmosphere and atmospheric circulation patterns (WWF, 2011). The polar jet stream is a high-altitude, blisteringly fast wind that blows around Earth at mid- and polar latitudes. It dips into and out of the Arctic, shifting high and low pressure air masses. Rising temperatures in the Arctic slows and increases the waviness of the Jet Stream which generates more south to north transfer of temperate and tropical warmth into the Arctic together with a greater export of Arctic cold to lower latitudes. Experts view a tipping point for ocean circulation to be somewhere around 4C warming (Lenton, 2012) while atmospheric circulation is more difficult to assess and needs to be further investigated.     

Thawing permafrost & Methane 

permafrost_feedback.jpgPermafrost—the ground that stays frozen for two or more consecutive years—is a ticking time bomb of climate change. Some 24 percent of Northern Hemisphere land is permafrost. That's 23 million square kilometers found mostly in Siberia, the Tibetan Plateau, Alaska, the Canadian Arctic, and other higher mountain regions. When the Arctic warms, permafrost can start thawing and releasing carbon and methane into the atmosphere (figure 2). In a controversial paper in Nature, Comment, Whiteman et a. (2013) posited a scenario whereby a 50 Gigatonne (Gt) methane pulse would occur over a decade time period and calculated its potential economic costs. To put this in context, the total amount of methane in the world’s air now is about 5 Gt, and the annual input is about 0.5 Gt, so this would double the methane in the air within the first year. Newspapers such as the Guardian and popular blogs were quick to pick up the story and claimed that there was a possibility of an Arctic “methane bomb”. Following articles have, however, shown little evidence pointing to the likelihood of such a scenario. A group of international scientists wrote in Nature Geoscience in 2014 that “significant quantities of methane are escaping the East Siberian Shelf as a result of the degradation of submarine permafrost over thousands of years” (Shakova et al. 2014). The authors claim that a sudden release of methane, in a “pulse”, seems unlikely and that methane will probably continue to bubble up slowly, contributing to greenhouse gases in the atmosphere. But they do caution that its possible that global warming could cause more storms in the Arctic Ocean, releasing methane on a bigger scale. There is no established tipping point for methane release, but some studies suggest that a tipping point for continuous Siberian permafrost thaw could be as low as 1.5°C warmer than the pre-industrial period (Oxford University). 

Consequences

Sea level rise
Sea level rise at +1-4C warming scenarios. Source: PIK

Sea levels are rising due to thermal expansion from warmer oceans and melting of land-based ice. Satellite measures since 1993 show global sea level rise of around 3.2 mm/year (CSIRO). The potential for increases in sea level rise is enormous because the ice caps of Greenland and Antarctic contain over 99% of all the freshwater on Earth (NSIDC). Estimates suggest that if Greenland ice sheets would melt completely it could raise sea level 6 meters. In other words, a one per cent loss of the Greenland ice cap would result in a sea level rise of 6cm (NSIDC). In a process that is accelerating, ice caps are losing mass. In past periods of Earth’s history, levels of atmospheric greenhouse gasses and sea levels have followed one another closely, allowing an inference about where sea level is headed. Sea levels may rise by more than 2 meters for each degree Celsius of warming the planet experiences over the next 2000 years (see figure), according to one study (Levermann et al. 2013). But even a one meter sea level rise could cause major problems for low-lying countries such as the Maldives and Bangladesh, forcing inhabitants to migrate. Around 150 million people live within 1 metre of high tide level (CSIRO). Coastal cities, ports and airports could be flooded, as could cities sited near tidal estuaries, like London. And many nuclear installations are built by the sea which is of great concern knowing what happened in Fukushima.

Extreme weather events 
Jet stream and hurricane Sandy.
Source: mprnews

Shifts in atmospheric circulation could influence weather patterns. Rising temperatures seems to slow down and increase the waviness of the jet stream, increasing long duration extreme weather patterns such as droughts, floods, and heatwaves (YaleEnvironment, 2012). This has significant impacts on temperature and precipitation patterns in Europe and North America. That weather patterns can "get stuck" might explain why the intensity of extreme weather events has increased. We have seen many examples of “stuck” weather patterns during the past few years. Deep southward dips in the jet stream hung over the U.S. east coast and Western Europe during the winters of 2009/2010, 2010/2011, and 2012/2013 bringing a seemingly endless string of snow storms and cold. In the early winter of 2011/2012, in contrast, these same areas were under northern peaks in the jet stream which brought unusually warm and snowless conditions (Francis, 2013). And in summer times persistent weather have been responsible for droughts and heat. The record heat waves in Europe and Russia have been linked to early snowmelt in Siberia (Jaeger and Seneviratne, 2011). These changes affects agriculture, forestry and water supplies. For example, farming becomes more precarious as weather patterns and prognosis are no longer reliable. Changes in weather patterns also impact storm surges and hurricanes. Some scientists suggest that changes to the jet stream drove hurricane Sandy west, towards the coast of northeastern United States (LiveScience, 2013). Ranking as the second costliest hurricane in United States history (Huffington Post, 2013) one can see how changes to storm patterns can have enormous costs to society and the economy.

Warming & Acidic Oceans
Coral reef at +1-3C warming. Source: FurmanWiki

The complete loss of Arctic summer sea ice has major knock-on effects, such as boosting phytoplankton and absorbing more heat in the oceans. Ocean warming effects marine life in temperate latitudes making species such as cod, haddock and flounder shift their geographic ranges, leaving fewer cold water species (NASA, 2013). Disease also spread faster in warmer water so parasites are having larger effects on species, especially sensitive coral reefs. Because the planet’s oceans currently absorb about a quarter of the carbon dioxide, which lowers the pH level of the water, the oceans are becoming acidic. Acidification makes shell-formation among marine organisms such as plankton and mollusks more difficult, which could have major cascading effects on marine life as these organisms make up the base of the ocean’s food chain. Coral reefs, which are marine biodiversity hotspots, are particularly sensitive to changes in temperatures and pH. Coral reef ecosystems are in global decline and this means loss of storm buffers and loss of estuaries for fish species that generate 200 million jobs and food for a billion people (NOAA).

Summary - Tipping points

Greenhouse gasses
According to most scientists, a CO2 amount of order 450 ppm or larger, if long maintained, would probably push Earth toward an ice-free state (Hansen et al. 2008, 2013). 450 ppm is considered a climate tipping point, beyond which we would have no control. We are at 400 ppm today, which constitutes high risk of transgressing the tipping point. According to science we need to get back down to 350 ppm to be considered in the safe zone. 

Arctic ice free summers

Some studies suggest that we may have passed a tipping point in relation to having sea-ice free summers in the Arctic already in 2007 (Livina and Lenton, 2013). The loss of reflective surfaces in the summer reinforces further warming, as dark water absorbs more heat from the sun, causing further melting. The loss of summer sea-ice cover is reversible, given that warming slows down (i.e. drastic reduction in greenhouse gas emissions). 

Greenland ice sheet

By looking at sediment records a team of scientists found that 1°C warmer than today's temperatures in Greenland contributed to a 4-6 meter sea level rise from the collapse of the southern part of the ice sheet (Reyes et al., 2014). 

Permafrost methane release

At 1.5°C warming, from pre-industrial levels, Siberian permafrost starts thawing on a large scale (Vaks et al., 2013). Crossing this tipping point could potentially lead to runaway climate change because of the scale of carbon stores and because methane is 20 times more effective in increasing global temperatures than equal amount carbon dioxide.

Conclusion

What is happening in the Arctic impacts us all. Rapid climate changes are now taking place in the Arctic with impacts on a planetary scale. We do not know how to fix it except from lowering our emissions. Many experts say we need a rapid reduction in greenhouse gas emission, starting now. Global leaders have to come to an agreement that substantially reduces emissions, the rich world taking the lead. Our only home, the Earth, is changing rapidly and we are now running into dangerous risks of substantial warming and triggering climate tipping points that reinforces further warming beyond our control. The last call is coming up in November of 2015 Paris Climate Meeting. “The Arctic acts as an early warning system for the entire planet” (Dr. Chip Miller, NASA Jet Propulsion Laboratory). We should all follow what happens there closely and warn the world of the potential dangers of going on with "business as usual".

Social welfare in an era without growth

Photo: Martin Addison, Creative Commons (CC-BY-SA)

What is the future for the welfare state?

Sweden, the EU, and other nations are entering a period of enormous change. Population and economic growth are stagnating and will end. Current policies for social welfare are not designed to meet these challenges and there is a significant chance they will fail in achieving their set targets. Many western countries are now at a crossroads. They can either pursue old policies that depend on growth and fail, or decide that the end of growth gives them interesting new possibilities and have a chance to succeed.

The end of growth

1. LTG Business as Usual Scenario (dotted line)
and historical data. Source: Turner (2014)
We have known for a long time that there are physical limits to population and economic growth in terms of what the Biosphere can provide. The Limits to Growth (1972) “business-as-usual” (BAU) scenario produced about forty years ago now aligns well with historical data that has been updated (Figure 1, Turner, 2014). Showing that we are headed in the wrong direction, away from achieving sustainable development. The BAU scenario results in collapse of the global economy and environment, subsequently forcing population down. A collapse in this context simply refers to the fact that standard of living will fall at rates faster than they have historically risen, due to disruption of economic functions. According to the model, a fall in population only occurs after about 2030 but the general onset of collapse first appears at about 2015 when per capita industrial output begins a sharp decline (Turner, 2014). Given the imminent timing, we ought to raise the question whether the current economic difficulties are related to dwindling resources and an end to growth.


Time of great stresses

Most people assume that the major global difficulties will occur after the end to growth. According to Dennis Meadows, one of the original authors of the book limits to growth, this is not correct. Instead, the global population will experience the most stress prior to the peak, as pressures mount high enough to neutralize the enormous political, demographic, and economic forces that now sustains growth. Pressures building up can take many forms, for example, rising energy and resource costs (A), growing debt (B), climate change (C) and growing population dependency ratio (D).

A) Rising resource costs
The history of commodity prices has generally been one of steadily decline for most of the last century. However, the average price fall of some 1.2% a year (inflation adjusted) met it’s low point in 2002. Since 2002 we have seen a remarkable price rise in most commodities (Figure 2). Rising energy and food prices, for example, seems to be the new normal. Unless there is a global economic contraction, prices will likely continue to rise.


2. Commodity indices (1900-2010) - Paradigm shift Source: GMO (2011)

B) Growing Debt
The European Union have/is experiencing a major debt crisis (figure 3 and 4) which have brought about massive unemployment, falling investments, and decreasing confidence in economic recovery. Social safety nets have broken down and a whole generation may be lost. Harsh austerity measures on public expenditures have been taken and vulnerable people are suffering. Such policy decisions can be recognized in neo-liberal economic doctrines, where market confidence is more important than financial politics as a political and economic tool. Almost no reforms have been made to rein in financial excess, e.g. financial transaction tax, since the start of the crisis in 2008. By allowing the financial sector to dictate what is politically feasible the EU has turned it’s back on citizens and discontent is growing, feeding the rise of extremist political parties.
3. Public debt in % of GDP in 2013 (left) 4. Private debt in % of GDP in 2012 (right). Source: Eurostat
C) Climate Change
One effect of climate change is changes in precipitation patterns and increased variability in crop yields. At the moment yields of several crops in Europe are stagnating (e.g. wheat) or decreasing (e.g. grapes in Spain), whereas yields of other crops (e.g. maize in northern Europe) are increasing. Extreme climatic events, including droughts and heat waves, have negatively affected crop productivity during the first decade of the 21st century. Figure 5. shows the projected mean changes in water-limited crop yield 2050, revealing a pattern of decreases in yields along the Mediterranean and large increases in Scandinavia. This will impact food production and food security, and may increase immigration patterns to northern Europe.
rainfed yields europe.png
5. Changes in water-limited crop yield (2050). Source: European Environmental Agency
D) Growing population dependency ratio
The world is aging at a rapid rate and by 2030 there will be 34 nations where more than 20% of the population is over 65 (figure 6). This has broad implications for economic growth and immigration trends. While Sweden's dependency rate will rise we still have a rise in population both from births and from immigration (SCB, 2014). Given today's immigration policy the potential to meet the growing needs of an aging population is better than other countries such as Japan or Austria.

6. Aging populations 2015 (left) 2030 (right). Source: CNNMoney

Potential Solutions?

Most common solutions to increased welfare costs depend on growth. For example through encouraging higher birth rates, raising immigration rates, increasing labor productivity, raising the retirement age and increasing taxation. Effective responses, however, are different. Especially if one is serious about creating a more resilient society. There will probably have to be a restructuring of the economy, a reorienting of capital and labor structure of society, from production toward maintenance, to serve an aging population and lower resource consumption. Priority has to shift from GDP per person toward maximizing human welfare directly i.e. using different metrics for national targets. Expenditures have to be reduced by developing non-market methods of social support (e.g. volunteer work, time-banking). The benefit of an aging population is that construction rates goes down, so does the need for police, prisons and military, while the need for health care increases. Shorter work time can give more jobs while allowing more leisure time. Shifting taxes from labor towards heavy industries and resource extraction is another interesting idea.

Summary

Several stresses are converging, creating difficulties for the welfare state. Especially in countries with demographic trends of having to care for a larger number of pensioneers. Dependency ratio will increase at the same time as GNP declines. Resource prices have reverted from their long-term downward trend, to increasing prices, but falling again in times of economic contraction.We have unsustainable levels of debt, especially unproductive debt (consumption and speculation), putting downward pressure on the economy. No government has yet tried to increase taxes a lot on the financial sphere or other efforts to get debt levels down, this is mainly because much of our growth today depends on ever increasing debt. Climate change will have many impacts e.g. increasing yields in the north and lower yields in the south of Europe. Scandinavia is in a better position than southern Europe to handle coming heatwaves and floods since temperatures are lower from the beginning. There is plenty of human capital and much work needed to be done (e.g. elderly care) but misalignment of incentives has led to massive unemployment and a generation of lost youths who can't get a job, even with a university degree. Potential solutions should involve changed goals, redirected investment and initiatives to engage the neglected work force. Sweden is in a better position than most other countries to achieve a more resilient society but radical thinking and a clear vision is needed if we wish to maintain our social welfare.

Crude awakening?

Oil market in turmoil

There seems to be a lot of confusion regarding the recent behavior of the world oil market. After five years of relatively stable oil prices, a barrel of WTI crude has dropped from around 110 to 81 dollar (see chart below). I have been following a discussion in the opinion-pages of Svenska Dagbladet clearly displaying this confusion. The discussion started with an article from Kjell Aleklett, a physics professor in global energy systems at Uppsala University, arguing that falling oil prices may signal the start of a global economic downturn. After which Magnus Grill, a political representative of the Peoples Liberal Party (Fp) and energy businessman, replied by arguing that Aleklett did not understand economic theory and that we instead more likely will see an economic upswing in the close future. So how come these two prominent people get to totally different conclusions? While this is a very complicated subject, fraught with international politics, there are some key points I would like to make from the natural resource dynamics and economics perspective.

Source: U.S. Energy Information Administration

Geological point of view

First of, Grill makes a fundamental mistake when he writes that the concept of peak oil is about running out of oil resources. Peak oil simply refers to the peak in production of oil, as opposed to demand which is generally assumed to increase. The concept is mainly useful for understanding that there are geological conditions/limits to oil extraction which makes oil increasingly expensive and harder to extract, leading to higher capital expenditures (i.e. diminishing economic returns). Peak conventional oil is according to many system scientists not some fuzzy academic concern but a reality, for the US in 1970 and for the world since about 2005-2008 (e.g. Hall, 2010; Turner 2014). Even the conservative IEA has warned about peak oil. The issue is not really about how much oil there is in the world, since there are surely untapped reservoirs, but rather how much effort we can afford spending trying to get to those oil resources. The harder we have to work for getting more oil (e.g. tar sands, fracking, and deepwater drilling) the less net energy we produce for society. In the 1970s every one barrel of conventional oil in form of energy input yielded about 30 barrels of energy in output (i.e. 30:1). Today that relationship is somewhere around 18:1 (Hall, Lambert and Balogh, 2014). Since oil is still the largest source for global energy use (~33%) this has significant implications for the overall economy. 

Economic point of view

Whether or not you buy in to the fact that non-renewable resources are finite and has a depletion function, or maximum yield curve, there are simple economic factors connected to oil which impacts growth. We also have to think about that oil is subject to supply and demand. So while Saudiarabia may have released some reserves, as they are the price setters, there are other more long-term trends influencing the market. Conventional oil production has been stagnating while the production of unconventional oil, especially shale oil in the US, has compensated for the decline and allowed for a small production increase. However, at the same time, many of the major economies are in recession and reducing their energy demand. For example, Italy has lost 25% of its oil consumption over the last five years (Bardi, 2014). And many other economies are in trouble, now even perhaps Germany. So if there is a increase in supply while demand is falling the market may eventually determine that oil prices should go down. Here, the role of financial operators perceptions play an important role. How low prices will go depends on several factors, but short-term the markets confidence in oil can influence large swings, such as the drastic drop witnessed in 2008-2009. And Saudi oil policy also matters. In the long term, however, oil prices are likely to rise. Secondly, Grill argues that lower oil prices is a good thing that could lead to economic upswing. That depends, if you are an importer or exporter. Sweden is dependent on oil imports, mainly for transportation. So for us it is perhaps beneficial but may also deter our society to shift from oil to other liquid fuels. But, lower oil prices hurts economies dependent on oil exports and non-conventional oil drillers dependent on a high oil price (around 75-90/barrel) to break even (Forbes). If oil prices stay low for any longer period industry will probably produce less oil. Thus, lower oil prices in a resource constrained world does not necessarily imply increases in global growth

Conclusion

This is in essence what peak oil means. Peaking does not mean running out of oil but rather that producing more oil becomes much harder/expensive than before. It is therefore possible that oil will cost less in the future, but that we won't have the money to pay for it. So the real question is, up to when are we able to afford further production? And the crucial point is that when a society's economy is based upon non-renewable energy resources there are limits to growth. It is just how nature works, the laws of thermodynamics, and there is no point in trying to argue with nature. There is however a point in arguing with Magnus Grill since he doesn't seem to understand the complex relationships between ecological and social factors influencing resource extraction and energy availability.