This years summer (April-July) in central Europe have been one of rainless weeks and relentless heat, as expected from climate models. Similarly to the summer of 2003, a large part of the continental EU was affected by a severe
drought in June and July 2015, as a consequence of the combination of rain shortages and
very high temperatures which resulted in high plant water requirement (evapotranspiration)
levels. France, Benelux, Germany, Hungary, the Czech Republic, northern Italy, and
northern Spain experienced particularly exceptional dry conditions.
Agricultural production has suffered in large parts of central France, south-central Germany and into Poland, Hungary, Ukraine and southwards into northern Italy and Spain. Grain harvests in Germany have fallen 11% and apple harvests 21%, while France expect a 28% drop in corn output. Record low river water levels in Poland have revealed Jewish tombstones and Soviet fighter planes, as well as human remains from the second world war.
Some parts of Germany have the lowest levels of soil moisture since records began in 1951. Restrictions to industrial and civil water use have been imposed. Monthly rainfall averages fell by as much as 80% in parts of France and northern Spain experienced daily temperatures over 30 degrees for more than 40 days.
 |
| Areas with the lowest soil moisture content since 1990 in July 2015 (in red) and in July 2003 (in blue).
Source: European Drought Observatory |
Ecological regime shifts
Human pressure on the planet's ecosystems have in some cases lead to gradual changes but more often it has lead to surprising, large and persistent ecological regime shifts. Such shifts challenges environmental stewardship because it leads to substantial changes in ecosystem services at the same time as these shifts are hard to predict and reverse.
A new study in
PLOS now indicates that the most common drivers to ecological regime shifts include:
climate change, agriculture and fishing. Aquatic systems, such as kelp forests, have been most affected by regime shifts. The good news, however, is that 62% of identified drivers can be managed at local or national scales, while only 38% can only be managed internationally.
Food production and energy consumption major drivers
According to the study, food production and climate change are key drivers of regime shifts that are coupled with one another and have the potential to lead to large-scale cascading effects. Food production relates to a number of negative drivers such as resource depletion, pollution, habitat destruction, and deforestation which have the potential to be managed locally or regionally. While climate change drivers needs to be managed internationally.
Most drivers of ecological change are increasing along with the exponential growth of the world's economy. So while reducing local drivers of ecosystem change can build resilience to continued global change over the short term, global changes will eventually overwhelm local management. Indicating that it is necessary but insufficient to act only on a local to regional scale.
Warmer waters in eastern Pacific Ocean
Every 3-7 years variations in tropical winds and pressure shift warm ocean water east to the South American coast, causing an El Niño event. Last time we experienced a really strong El Niño was in 1997/1998 but this years event have the potential to top that record, according to many scientists. There is a 90% chance that El Niño will continue through the Northern Hemisphere winter 2015-16 (
NOAA, 2015).
 |
The map shows sea surface temperature anomalies in June 2015. We can see that there is a long patch of warmer waters off South Americas west coast stretching all the way to Indonesia. This is a typical characteristic of an El Niño event. We can also see the "blob", persistent warm patch, off North Americas west coast that has impacted California's drought condition.
|
This week average temperatures jumped to above 1.9C which is much sooner than most models predicted, that indicated it would occur by October/November. We could reach ocean warming of 2.2 or even 3C above average by the end of the year. Such temperature anomalies would exceed the maximum values seen during the record 1997/98 event.
Worse weather under current climate change?
Combining our current climate forcing with such a powerful El Niño could mean that global average atmospheric temperatures will continue to hit record highs. The heat coming from the Pacific Ocean is massive and will probably reinforce the the "hot blob" in the Northern Pacific as well as transport warmer waters into the Arctic, through the Bering Strait. This could increase the melting of Arctic sea ice with a reinforcing feedback of further warming in the region. A powerful El Niño could also increase storminess along the south and eastern US and across the North Atlantic where a cold pool south of Greenland (associated with a weakening North Atlantic current) is already intensifying storms.
+2℃
This is the limit to average global temperature rise that the world has decided we should not cross this Century in order to prevent dangerous climate change. Some think of it as the safe limit despite many scientists warnings that we should really stay below 1.5℃ since two degrees would most likely have devastating consequences (
Hansen et al. 2013; Hansen et al. 2015).
+1℃
This is the amount of average global warming that we are now (2015) experiencing,
according to the latest data from NASA. The recent reading is the first to show a consistent break at 1℃ above 1880s levels and is a scary milestone towards the catastrophic 2℃ we really want to avoid.
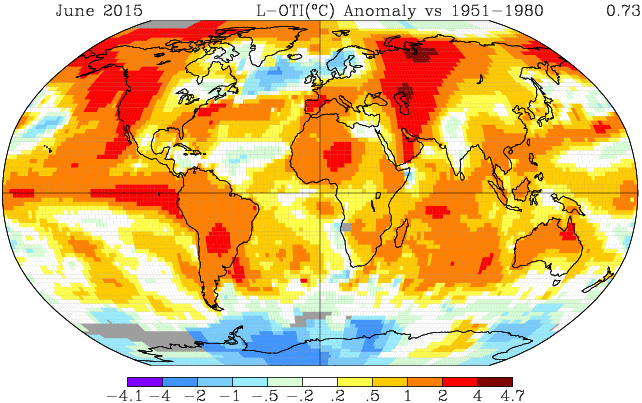 |
| NASA’s geographic temperature anomalies for a record hot June in 2015. Source:NASA GISS. |
The map above shows June temperature anomalies. We can see that there are large areas of 2-4℃ (orange-red) above average readings, mostly located in the Northern Hemisphere. Alaska, western Canada and western Asia has the highest readings. On average we can also see that most of the globe is at least 1℃ above normal, the exceptions being parts of the Atlantic ocean south of Greenland, Scandinavia and the South pole. This illustrates how one degree warming actually means a lot of different conditions around the globe. We have had heat waves in India and Pakistan, massive forest fires in western US and Canada and record breaking heat in parts of South America. But I’m afraid that most Swedes can only think of the rainy summer we are currently experiencing, which runs opposite to the global trend.
For those who don’t think +1℃ is such a big deal, lets look at some climate refugee statistics. Only 40 years ago, Earth’s climate was more stable with less extreme weather, when average temperatures were only 0.5℃ cooler than today. Mainly because there was less available heat energy to pump up storms and melt the polar regions, which is now impacting global wind patterns. We now live in a more dangerous world with a climate system more prone of producing extreme and disruptive weather events.
According to the
Internal Displacement Monitoring Agency (IDMA) every person on Earth is now on average 60% more likely to be forced out of their homes by natural disasters, compared to 1975 (population growth accounted for). This is a staggering increase! Over the past 7 years some 158 million people have been forced to flee their homes due to natural disasters. In 2014, 92% of the total or 17.5 million people were forced to flee due to extreme weather events. The typhoons and floods in the Philippines and India ranking as the worst. Between 2008-2014, floods (55%), storms (29%), Earthquakes (14%) and extreme temperatures (1%) were the most common natural hazards leading to displacement. East Asia and the Pacific, which are densely populated developing regions, have been worst impacted.
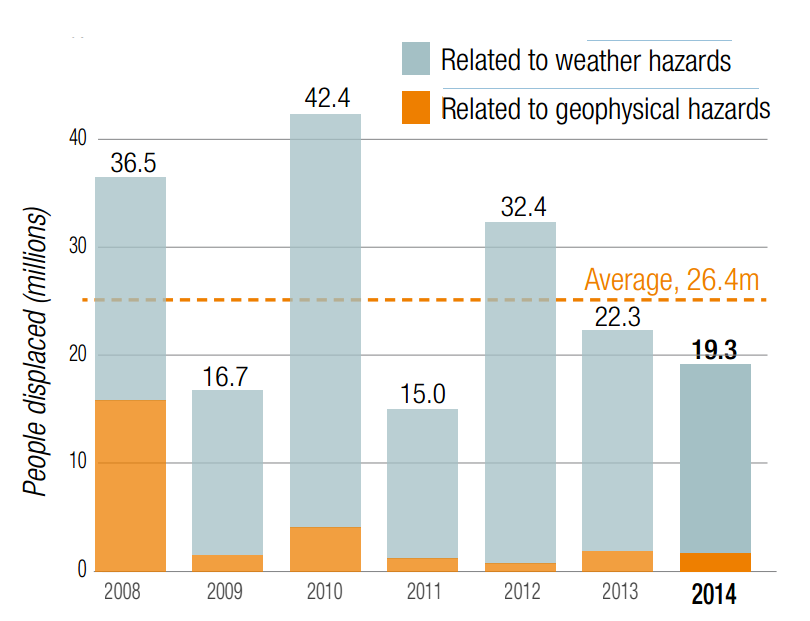 |
Since 2008, an average of 26.4 million people have been displaced from their homes each year by disasters brought on by natural hazards, equivalent to one person displaced every second. Source: IDMC 2015
|
Abrupt climate changes to drier conditions impacted the fall of ancient civilisations in the fertile crescent
New research reveals that some of the earliest civilisations in the Middle East and the Fertile Crescent may have been affected by abrupt climate change. Abrupt climate changes occur in the span of years to decades.
A team of international scientists led by researchers from the University of Miami have found that during the first half of the last interglacial period known as the Holocene epoch, which began about 12,000 years ago and continues today, the Middle East most likely experienced wetter conditions in comparison with the last 6,000 years, when the conditions were drier and dustier.
The Fertile Crescent, a region in west Asia that extends from Iran and the Arabian Peninsula to the eastern Mediterranean Sea and northern Egypt is one of the most climatically dynamic regions in the world and is widely considered the birthplace of early human civilisations. The research team found that transitions in several major civilisations across this region, as evidenced by the available historical and archaeological records, coincided with episodes of high atmospheric dust. Higher fluxes of dust are attributed to drier conditions across the region over the last 5,000 years.
 |
| Credit: Arash Sharifi |
Climate variability during the past 5000 years is shown in the diagram above. The vertical orange bands denote periods of dry and dusty conditions, which correlate to historical records of drought and famine. Transitions between ruling dynasties (grey arrows) in Iran and North Mesopotamia coincides with the episodes of dry and dusty condition in the region.
Forest fires, heat waves and heavy precipitation events
In June this year we saw record heat in South America and Western United States but the weather here in Scandinavia has been very rainy and a bit cold this summer. How come?
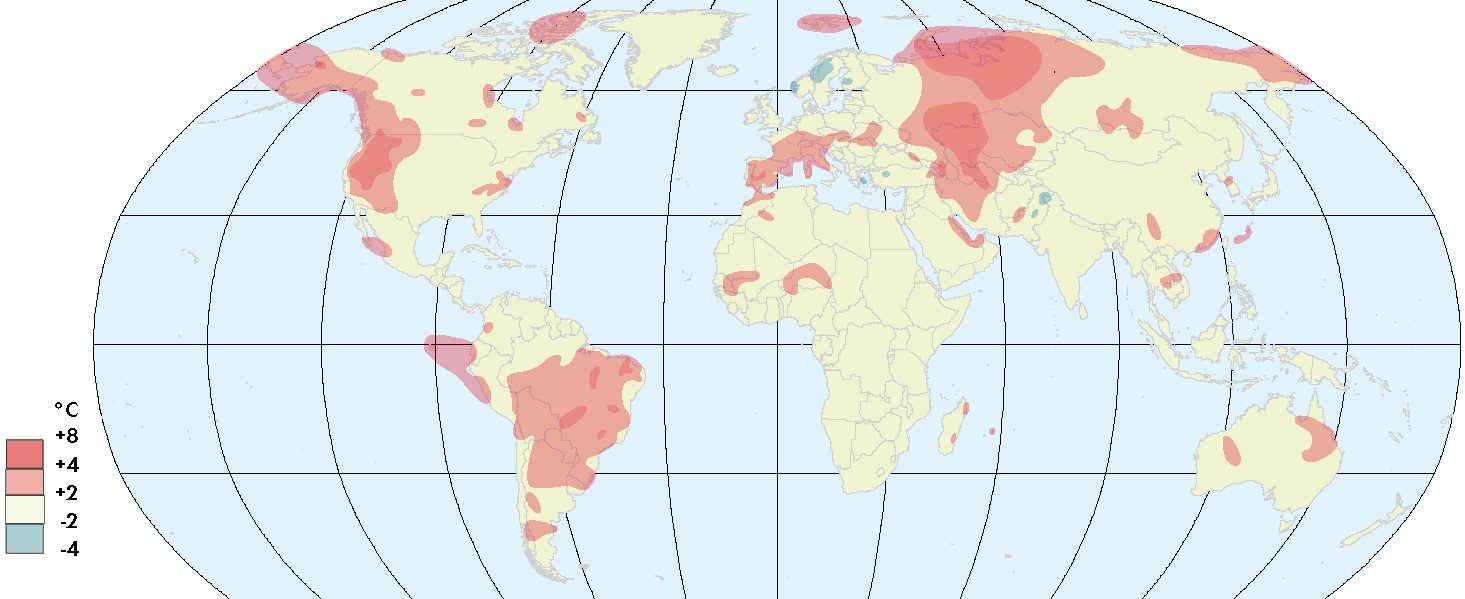
The heat wave that struck Pakistan in June resulted in many deaths and temperatures reached 40-44 degrees Celsius in Portugal and Spain at the end of the month. As we can see on the map below, some regions of the world have experienced high temperature anomalies for June. Venezuela, Argentina and Colombia noted new heat records, and massive forest fires have been burning in Canada and Alaska, while we here in Scandinavia have experienced a very rainy summer. It's like weather patterns are getting stuck, perhaps they are?
Changing wind patterns
That is at least one credible theory discussed by
Francis & Vavrus (2015). According to the authors new metrics and evidence support a linkage between rapid Arctic warming, relative to Northern hemisphere mid-latitudes, and more frequent wavy jet-stream configurations that favour persistent weather patterns. Results suggest that as the Arctic continues to warm faster than elsewhere on the planet in response to rising greenhouse-gas concentrations the frequency of extreme weather events caused by persistent jet-stream patterns will increase. In that context, heat waves in Pakistan, forest fires in Alaska and Canada and heavy precipitation events in Scandinavia makes sense. Because the temperature gradient between the north pole and the equator has decreased, as more ice melts due to warming, wind patterns start forming more strange patterns that tend to “get stuck”.
The Arctic has warmed approximately twice as fast as the Northern mid-latitudes since the 1990s, a phenomenon known as Arctic amplification. This disproportionate temperature rise has influenced large wind circulation patterns, i.e. the polar jet stream, slowing them down. In areas and seasons which temperature gradient have weakened due to Arctic amplification we can now observe wavier and meandering jet-stream patterns.
Changing Ocean Currents
In another study
Moore et al. (2015) points out that the loss of sea ice in Greenland and Iceland Seas is affecting the production of dense water that forms the deepest part of the Atlantic ocean current (AMOC) that carries warm water from the tropics northward to Europe and the North Atlantic and cold water southwards. The authors state that this could potentially lead to colder climate in northwest Europe.
Because the Greenland Sea provides much of the mid-depth water that fills the Nordic Seas the observed change in ocean mixing, from once deep mixing to now only shallow mixing, could potentially change the temperature and salinity characteristics of these seas. A slowing down of the Atlantic ocean mixing currents could have dramatic impacts on the climate of the North Atlantic and western Europe. In particular, it would reduce the volume of warm water transported at the surface towards western Europe. More research is needed before we can really understand how the slowing down of North Atlantic ocean currents could impact European climate. But one thing is sure, we are experiencing some weird climate these days and we have only warmed the planet to about 0.85 degrees Celsius, imagine what 2 degrees would be like!




 Posts


